Quantir UI Walkthrough
Whitepaper | Quantir UI Walkthrough | Use Cases | DeFi Risk Engine | Roadmap
This page is the UI companion to the Quantir whitepaper. The whitepaper explains the product, architecture, and analytical logic. This page explains how that logic is presented inside the application, how the main screens are organized, and what each visible module is intended to help the user do.
The purpose of this page is practical. A reader should be able to open it and quickly understand what the application looks like, how a user moves through it, and how the key modules support monitoring, investigation, and decision-making without overloading the main whitepaper.
For deeper technical materials, service notes, and supporting documentation, see DeFi Risk Engine.
Dashboard At A Glance
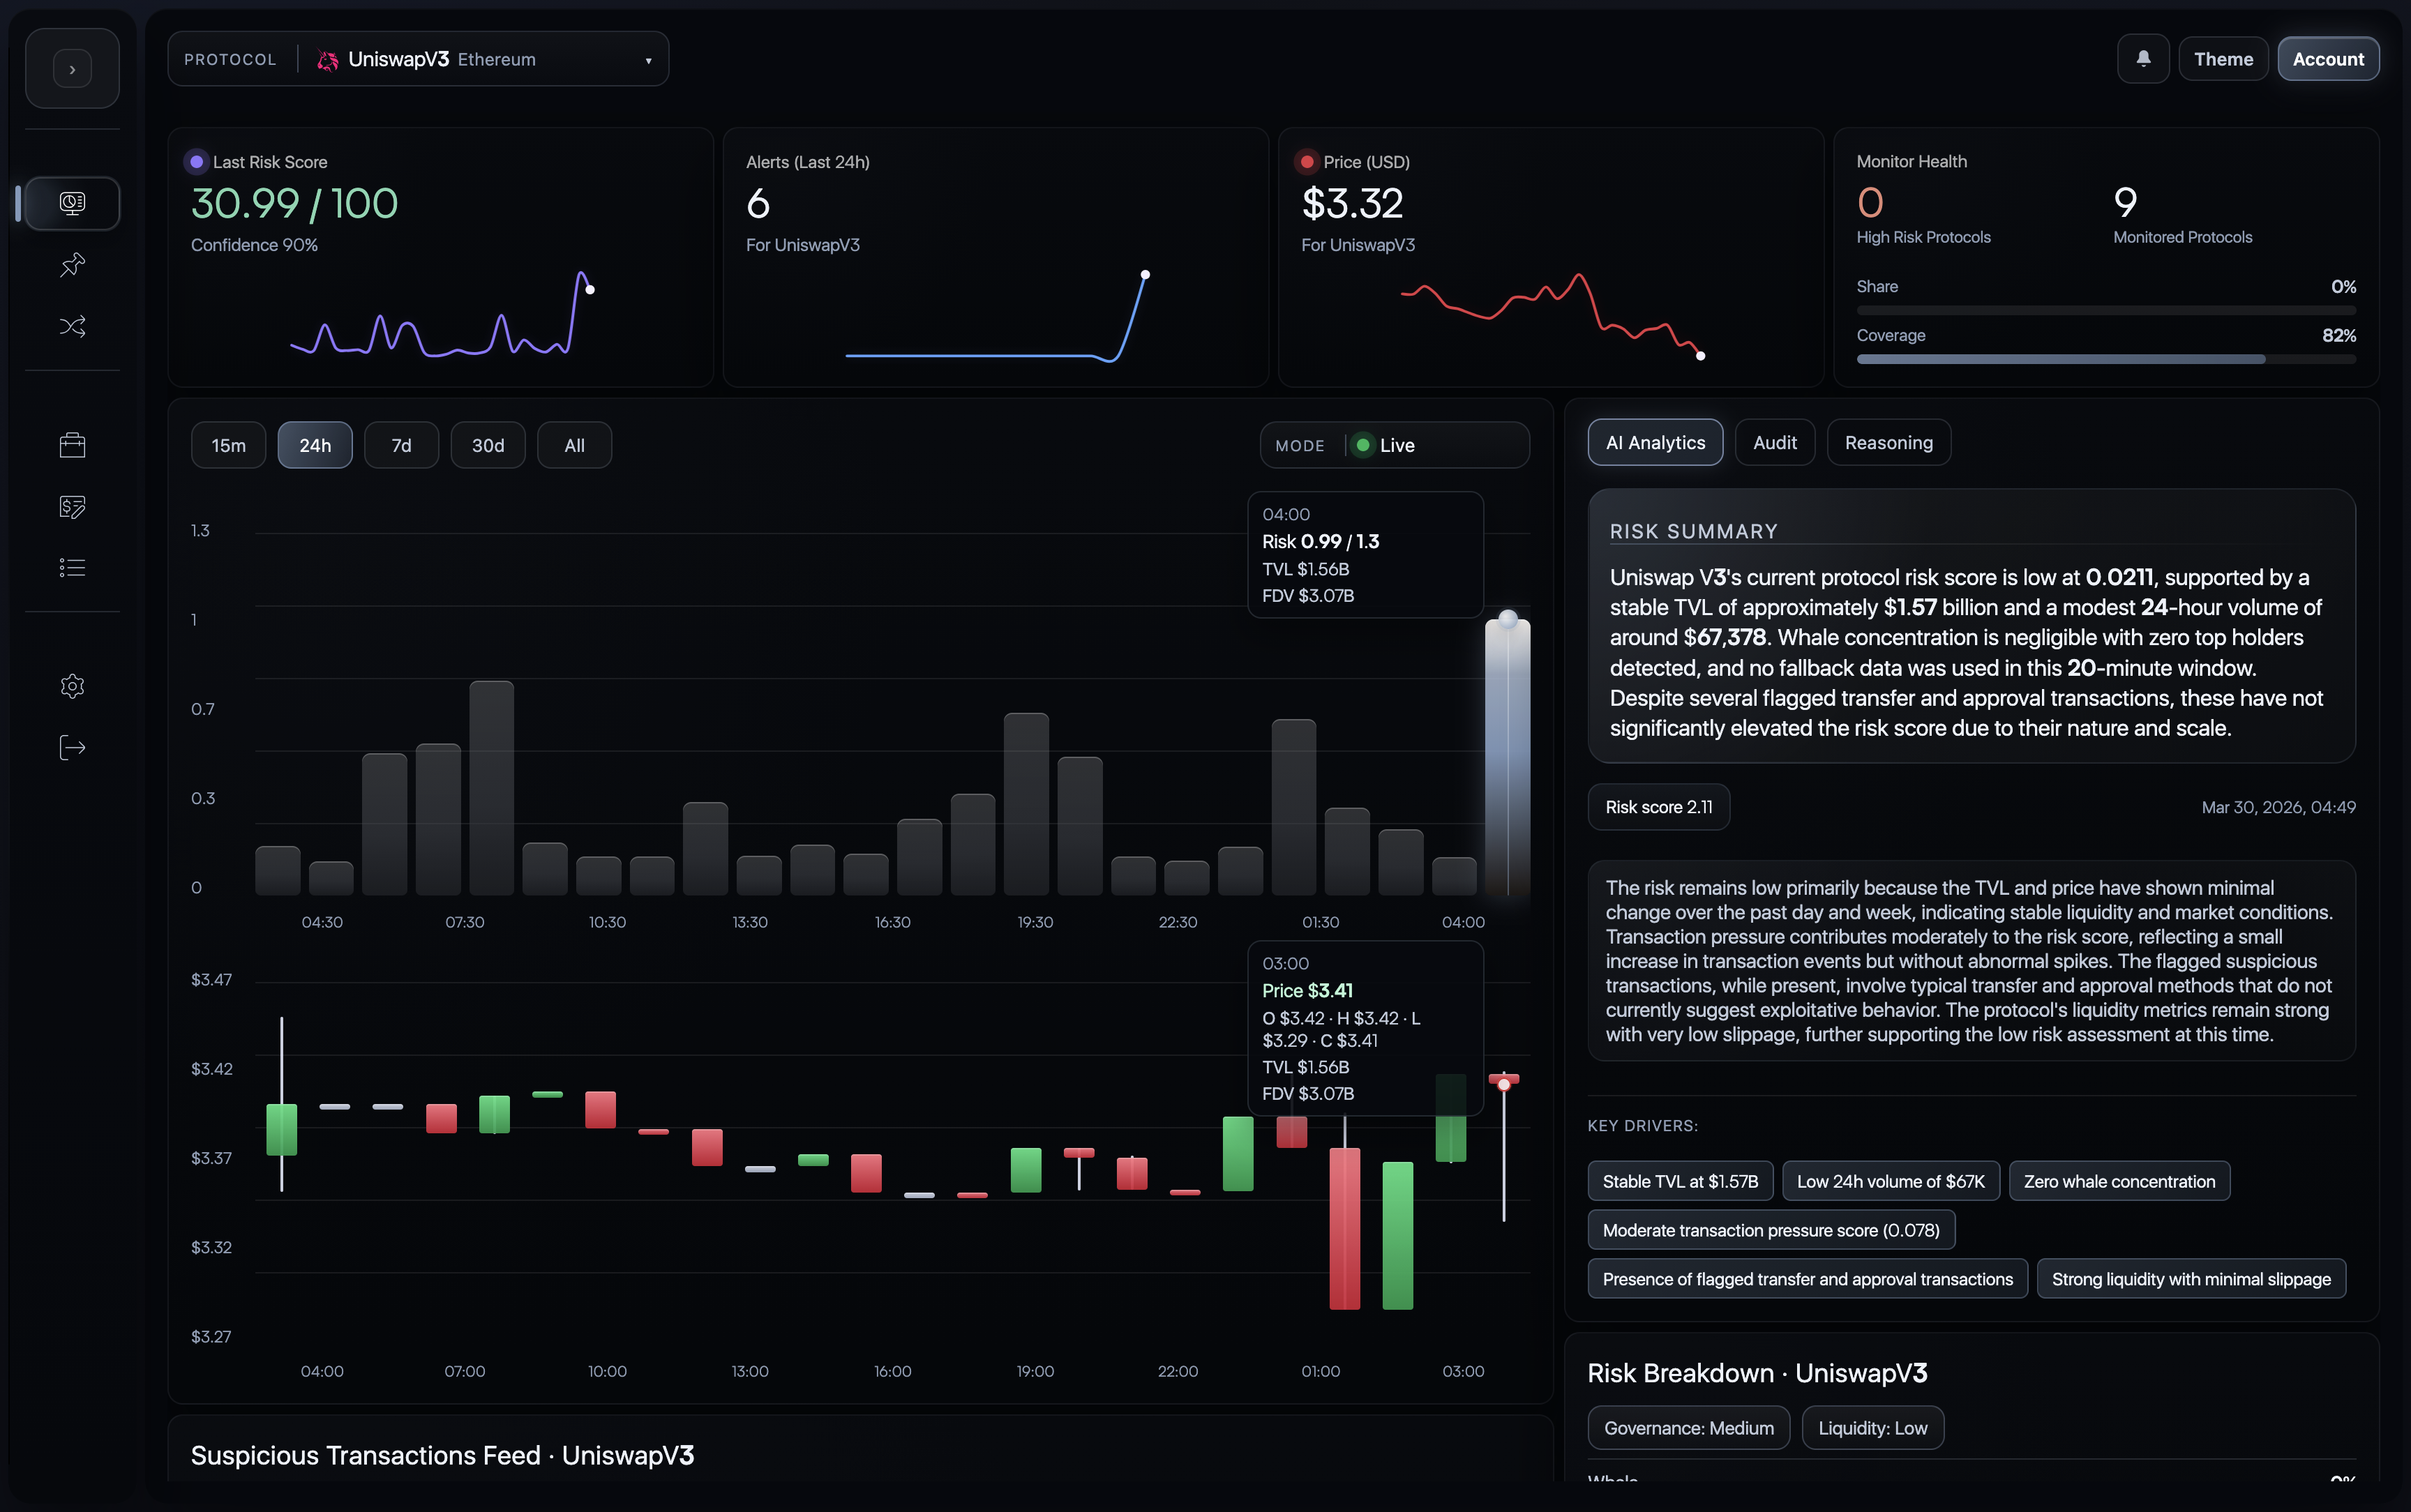
The dashboard is the central investigation surface of Quantir. It combines risk state, price context, event evidence, contract-aware analysis, and explanation into one analyst-facing workspace.
Reading Guide
- Start with the watchlist to decide which protocol deserves attention first.
- Open the dashboard for the selected protocol.
- Toggle
Live | Predictionwhen you want a forward-looking view of near-horizon protocol risk. - Use the AI, audit, and reasoning tabs to interpret what is happening.
- Move from summarized evidence into transaction-level and hypothesis-level detail.
1. Watchlist And Entry Workflow
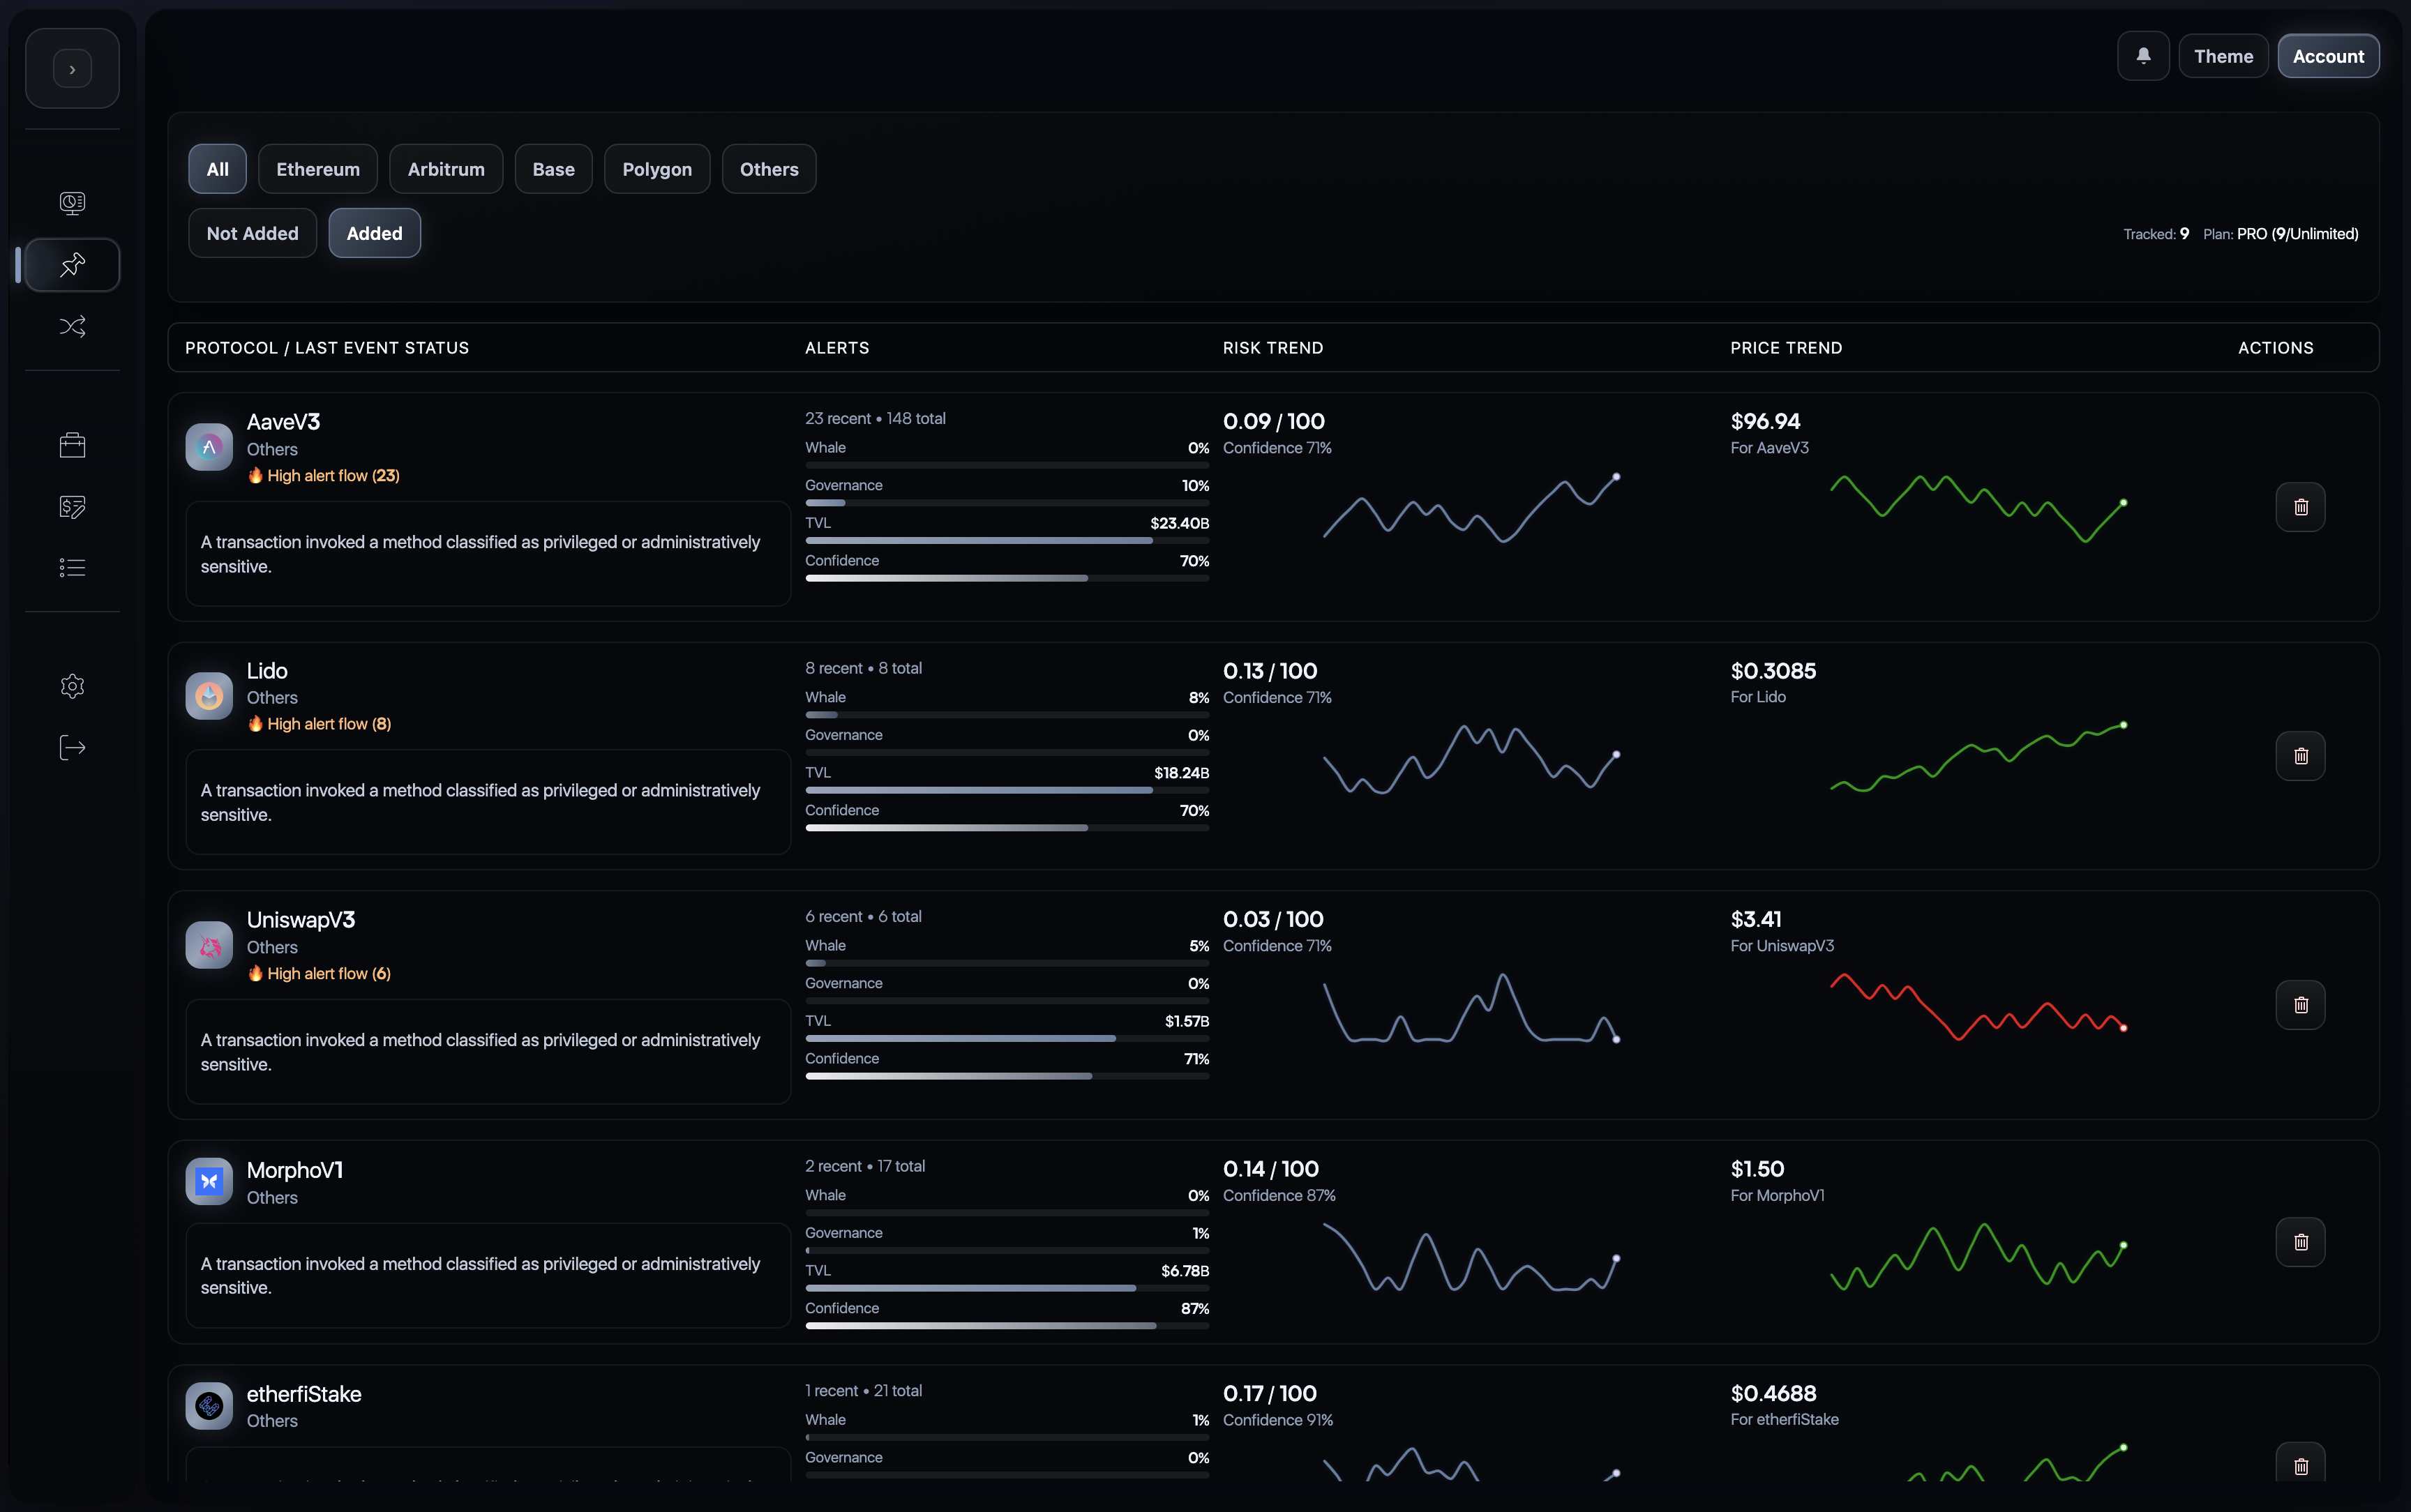
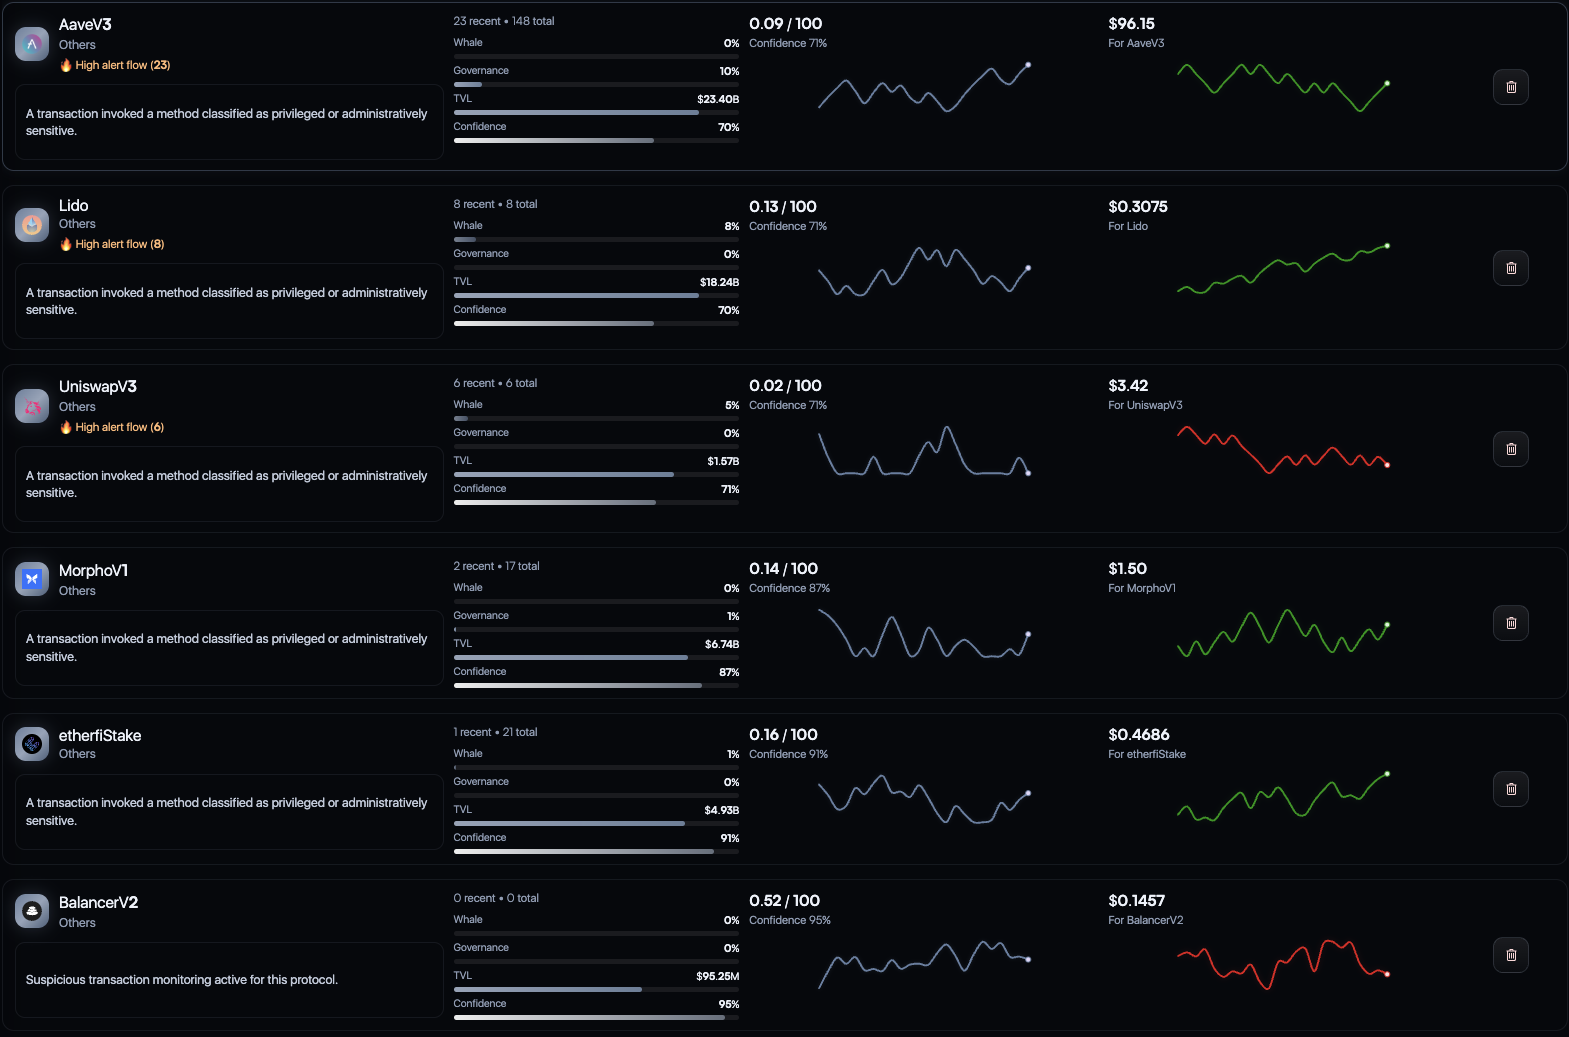
The watchlist is the entry layer of the product. It is where a user defines the active monitoring set and scans multiple protocols before committing attention to one of them in detail.
What This Screen Does
The watchlist is designed as a triage surface rather than a simple list of assets. Each row summarizes the current state of a monitored protocol so the user can quickly identify which protocol is becoming more interesting, more unstable, or more urgent.
In the current UI, the screen supports:
- network and category filtering
- separation between
Not AddedandAddedprotocol sets - scanning recent and total alert counts
- viewing protocol-level risk trend and price trend together
- quickly opening the most relevant protocol for deeper investigation
This is especially useful for users who track multiple positions or hedges at once and need to decide where their next unit of attention should go.
2. Dashboard Structure
The dashboard is where the user moves from monitoring into investigation. The upper part of the page establishes immediate context through:
- current protocol risk
- short-horizon alert activity
- token price behavior
- short-horizon forecast context
- coverage and monitoring status
- linked risk and price history
Below that, the dashboard shifts into evidence and interpretation. Suspicious transactions, contract-aware analysis, reasoning, and external context are all presented in one continuous workspace so the user does not need to switch between disconnected tools.
3. Live Prediction Mode
The chart area includes a MODE switch with Live | Prediction. When this mode is enabled, the dashboard stops being only a current-state chart and becomes a forward-looking risk surface as well.
What This Module Does
- projects the likely path of protocol risk roughly 30 minutes ahead
- uses the forecasting layer as additional context on top of the live risk score
- extends the chart with future forecast bars instead of opening a separate screen
- keeps the prediction attached to the same protocol, timeframe, and market context already visible to the user
How To Read It
The prediction overlay should be read as probabilistic context, not as a replacement for the current risk score. The live score still describes the present state. The forecast view shows where the system expects risk to move next if the recent evidence trajectory continues.
On the 15m chart this is especially easy to read. Two light-blue forecast blocks appear at the right edge of the risk panel, and the blue line traces the expected risk path through that next short horizon.
On the 30d chart the same module gives the user a much longer backdrop for judging regime behavior. The prediction line remains attached to the broader historical structure, which makes it easier to see how the model is extending the current state into a usable near-horizon risk expectation rather than simply reacting to one isolated move.
Why It Matters
This module adds lead-time. Instead of seeing only where protocol risk is now, the user gets a practical forecast of where it may move next. For LPs, hedged users, and operators, that extra 30-minute window can materially improve the ability to reduce exposure, adjust a hedge, or avoid reacting after deterioration is already obvious.
In product terms, this is also one of the clearest signs that Quantir is moving beyond passive monitoring. As the current screenshots suggest, even a model trained on a relatively small dataset is already producing promising risk-prediction behavior on both the 15m and 30d views. That makes the prediction module a natural part of the demo UI and of the broader forecast-aware evidence layer described elsewhere in the project.
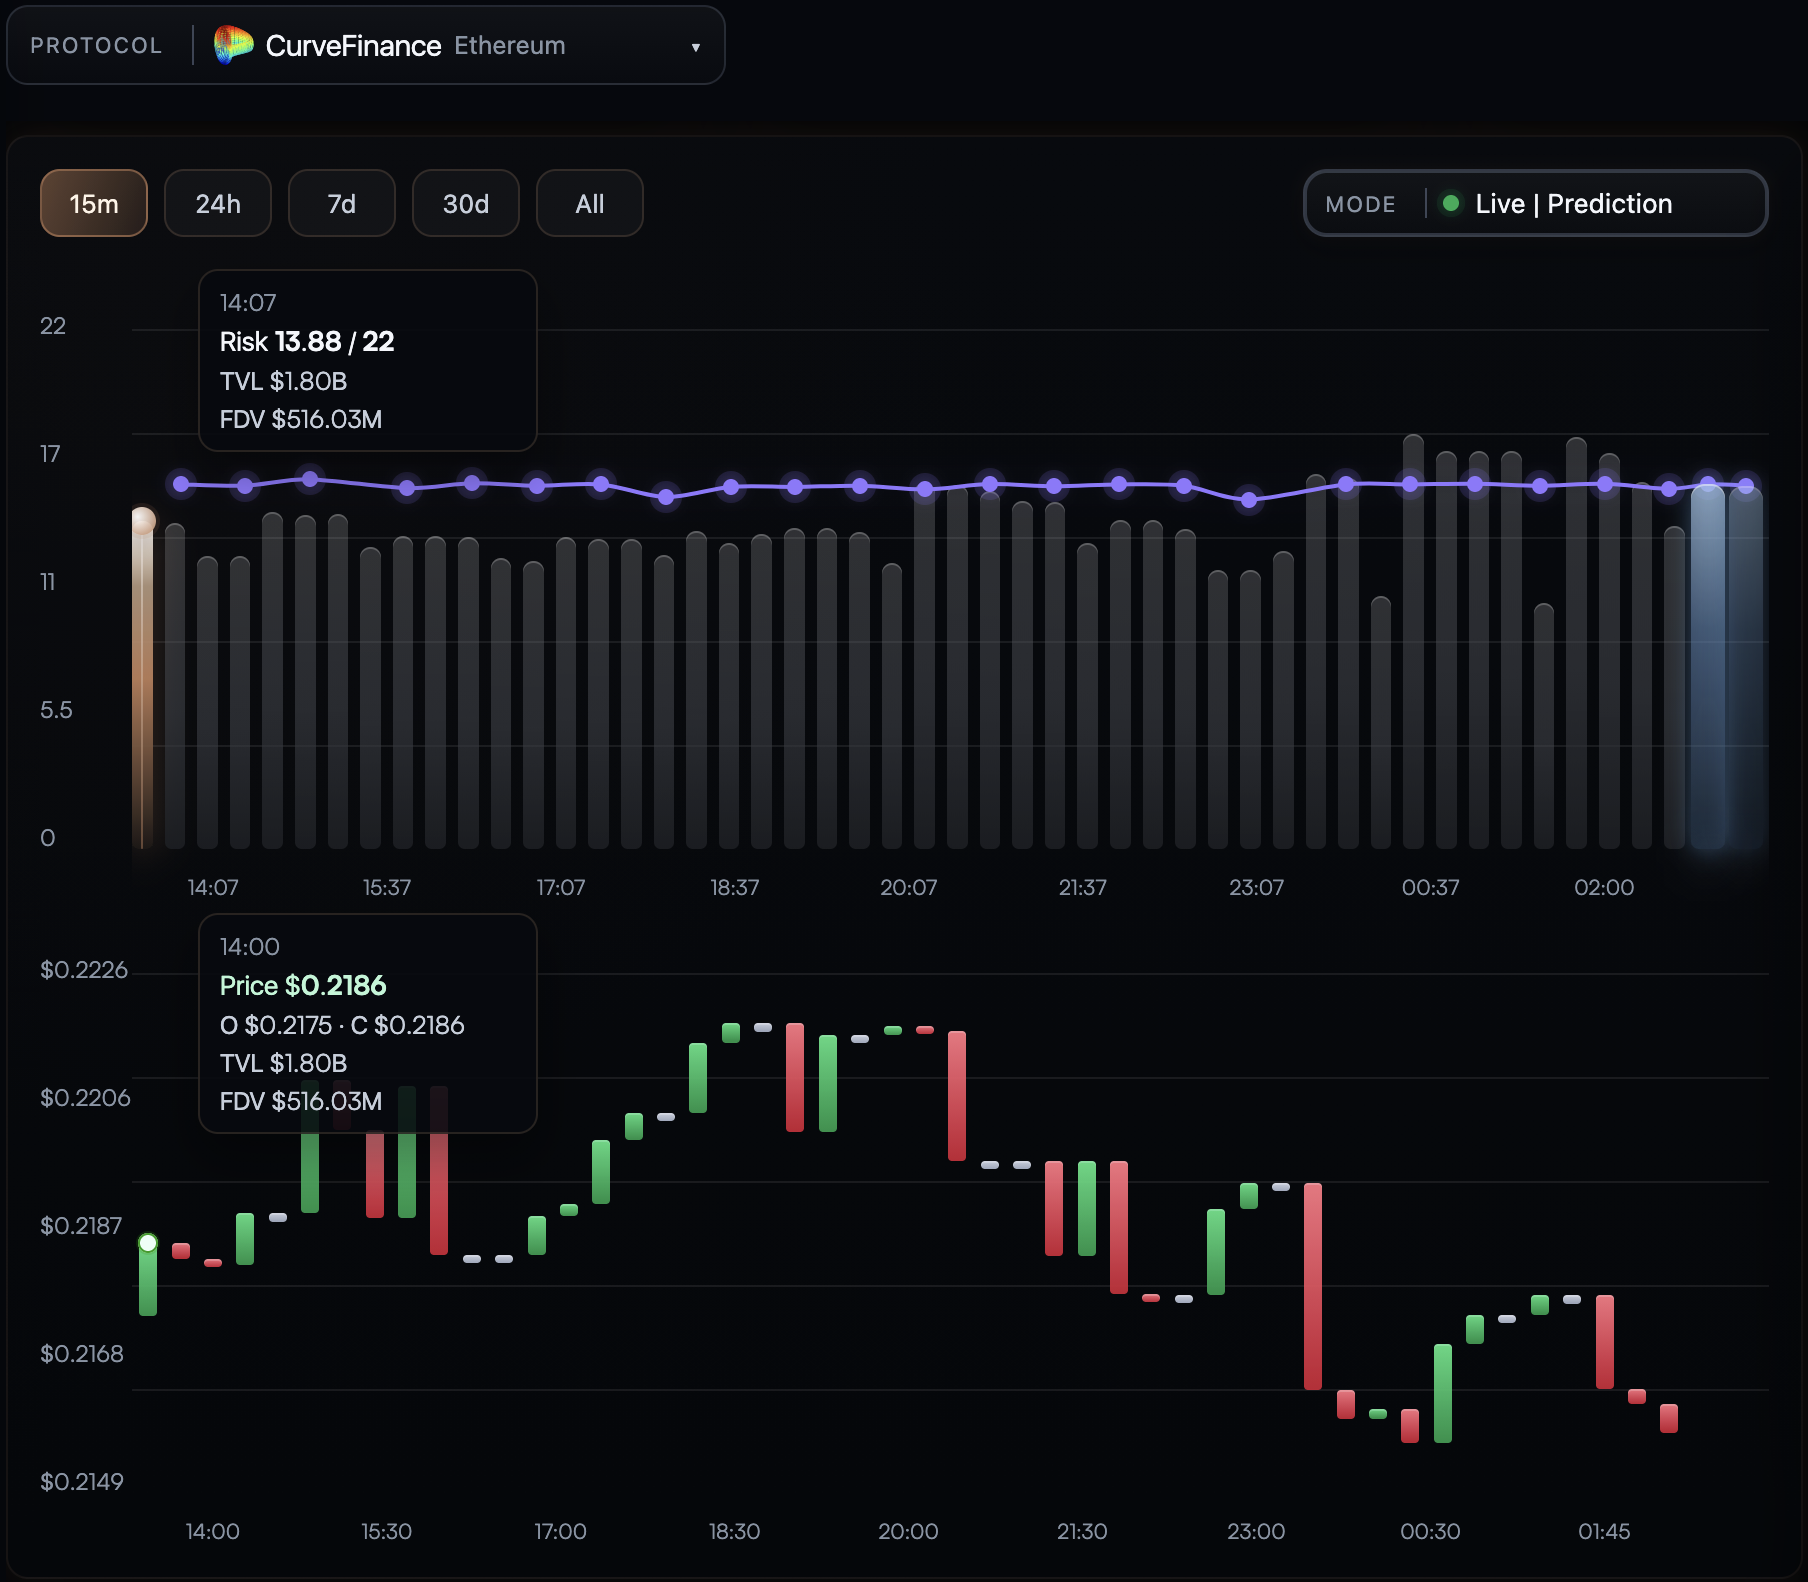
Live | Prediction on the 15-minute chart. The two light-blue forecast blocks on the right mark the future window, while the blue line shows the predicted risk path for roughly the next 30 minutes.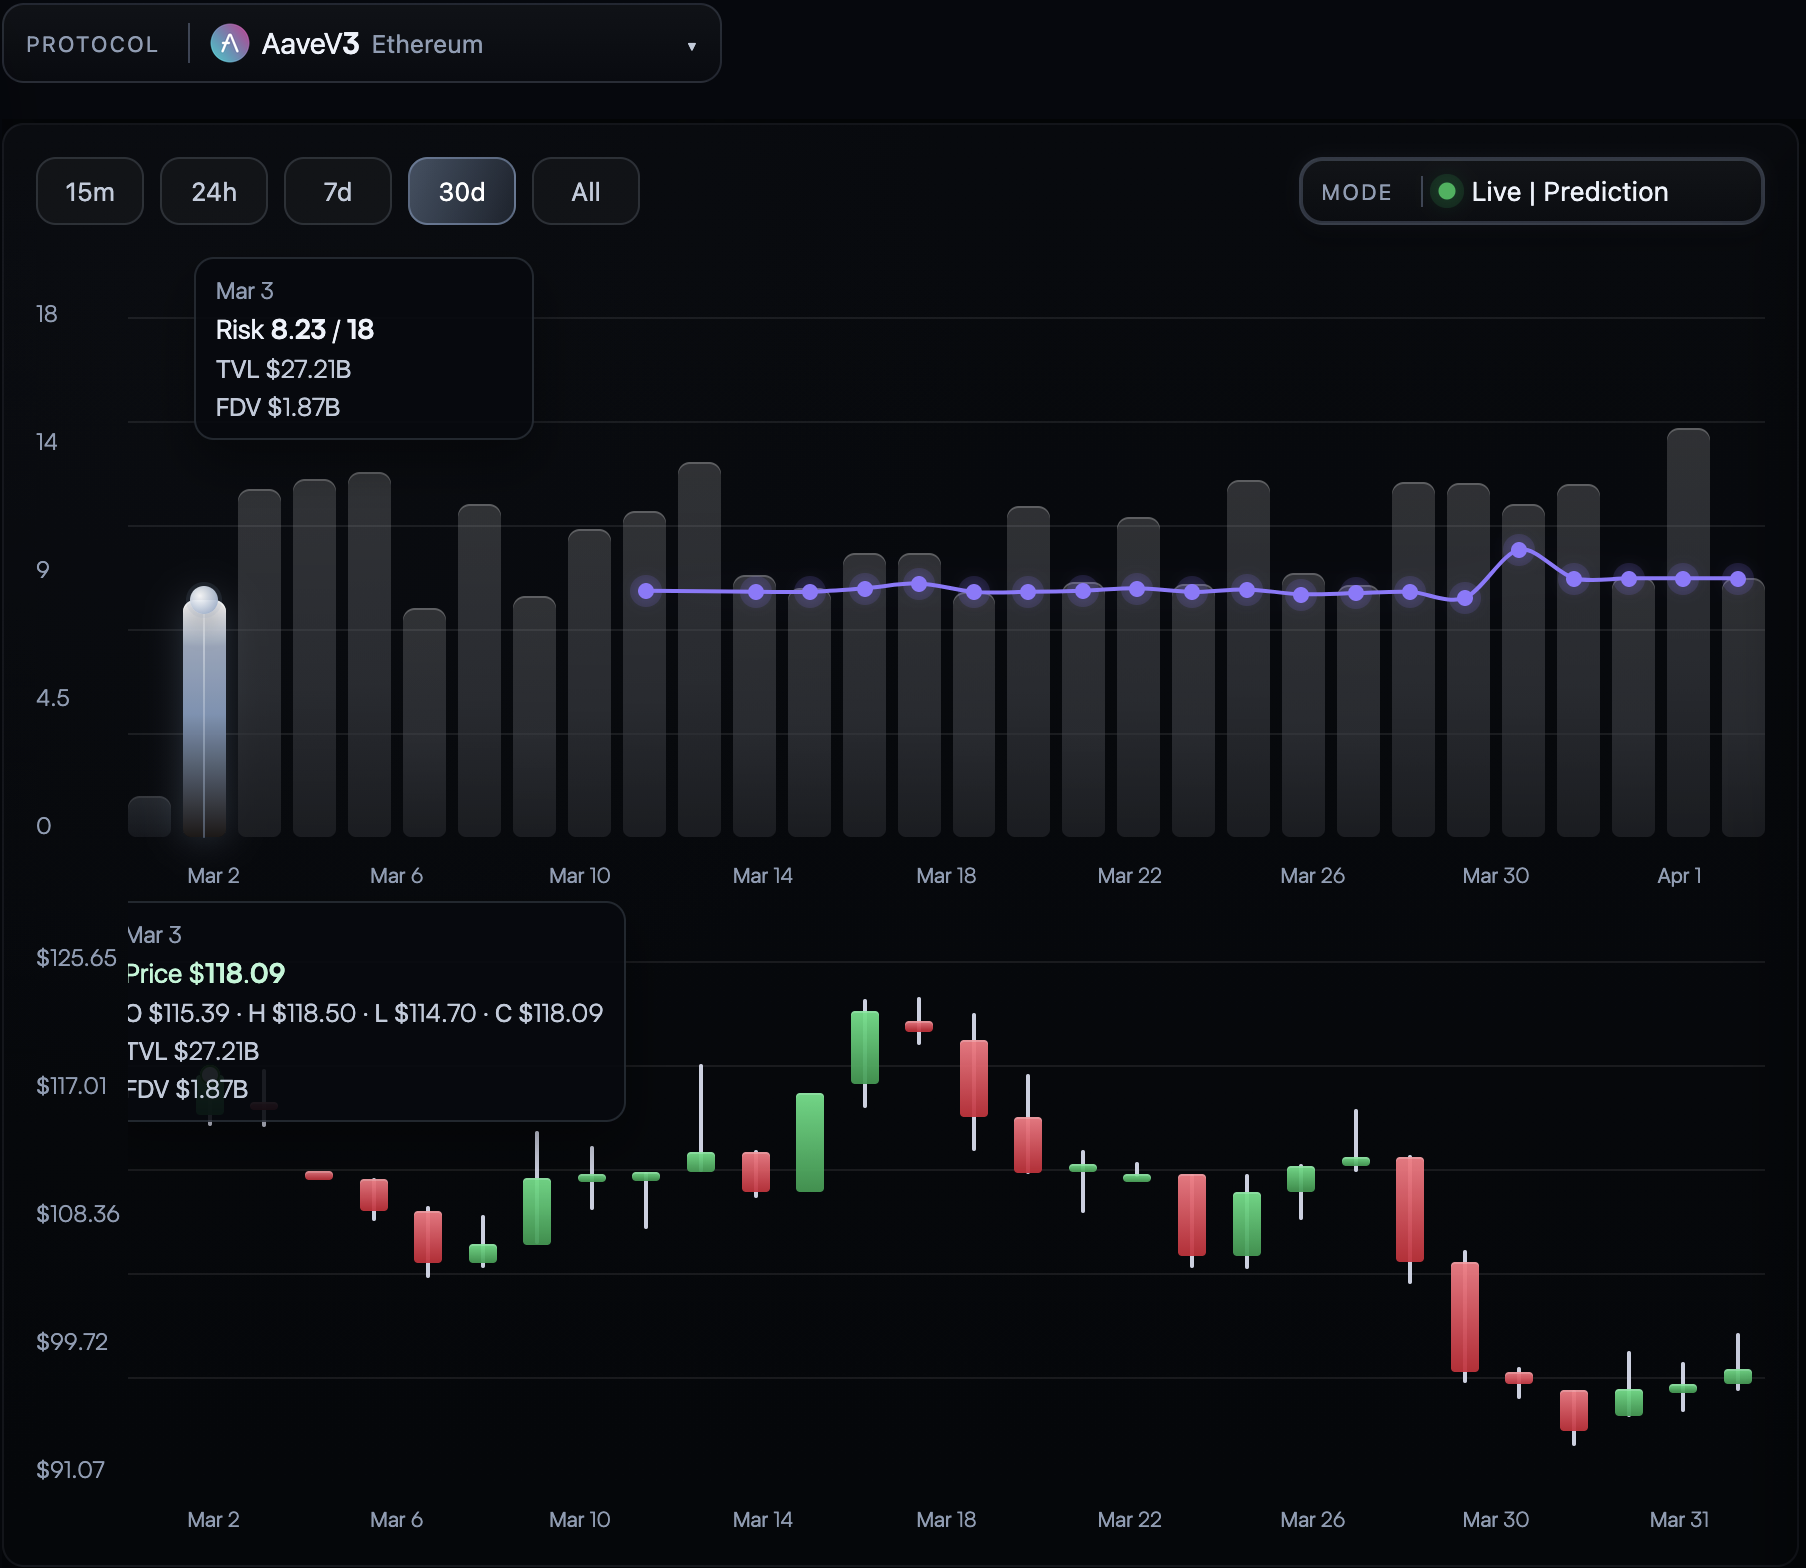
Live | Prediction on the 30-day chart. Even with a still-small training dataset, the current demo already shows encouraging risk-forecast behavior across a much longer historical view.4. AI Analytics Tab
Purpose
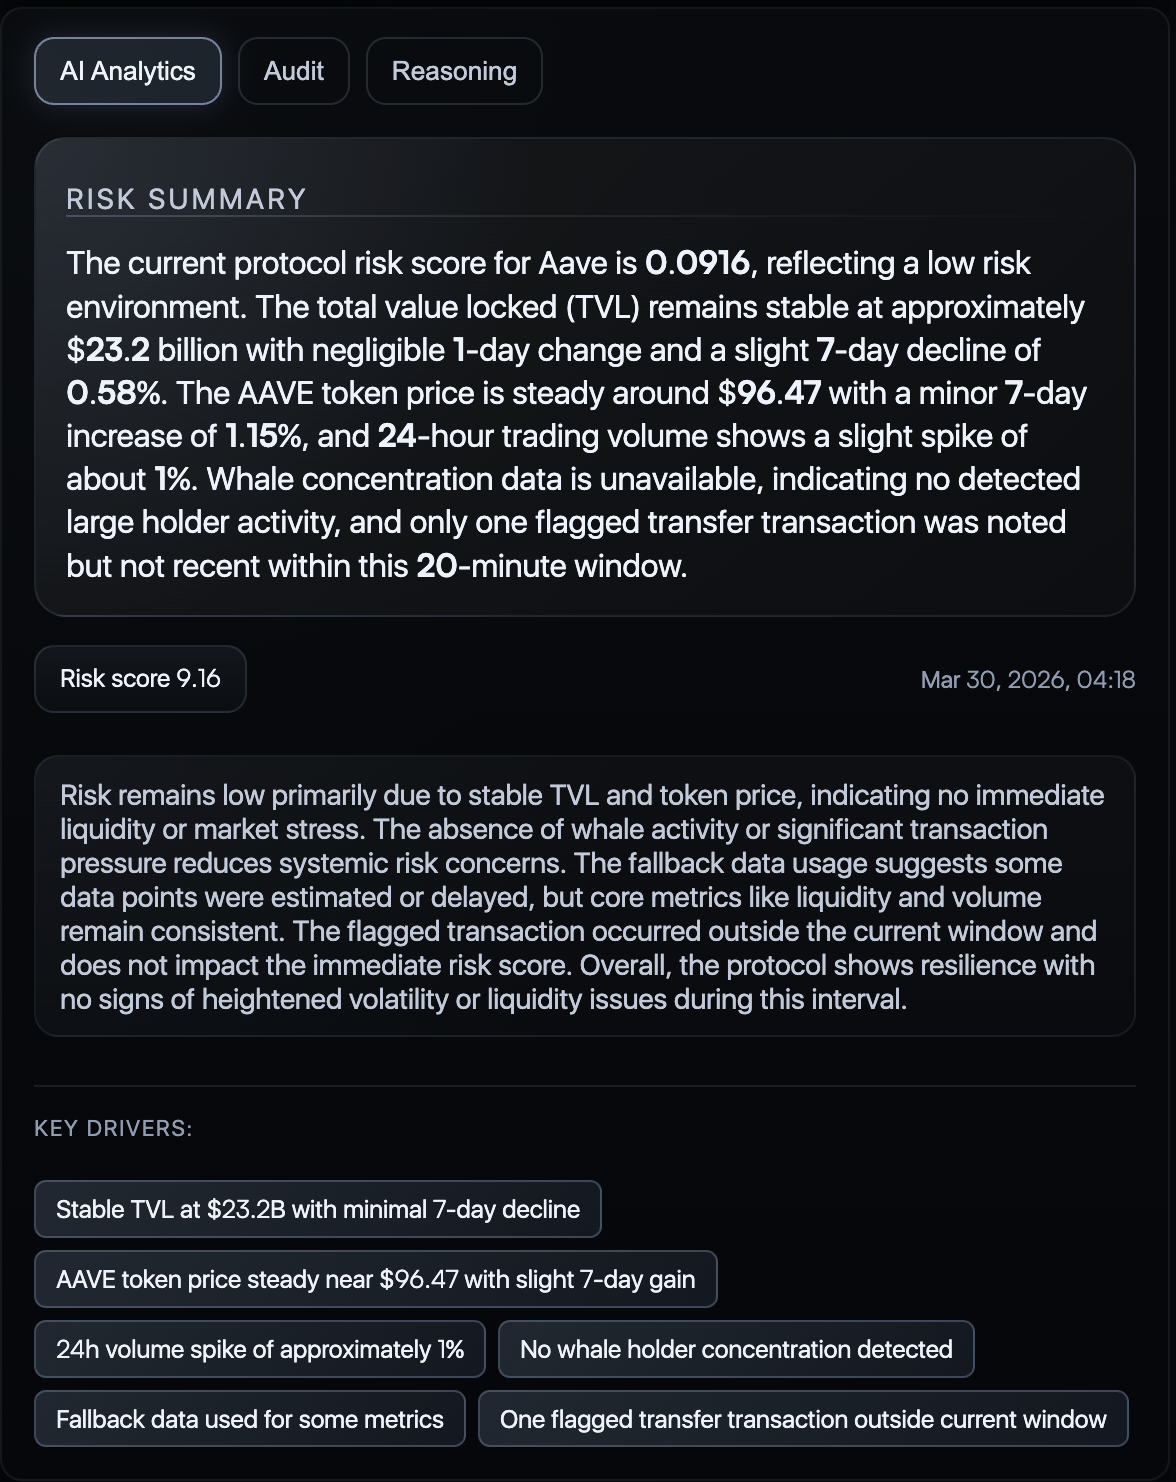
The AI Analytics tab gives a compact analytical summary of the protocol's current state. This is not the engine that creates the core risk score. Instead, it is the interpretation layer placed on top of the evidence and the existing risk model output.
What The User Sees
- current protocol risk summary
- concise explanation of why the current state is interpreted as low, medium, or elevated concern
- key drivers extracted from the active evidence surface
- timestamped reasoning tied to the current dashboard state
Why It Matters
This tab is intended to reduce the distance between raw signals and user action. A user does not need to manually synthesize TVL context, price movement, transfer behavior, and contract flags before getting an initial read of what the platform thinks is happening.
5. Audit Tab
Purpose
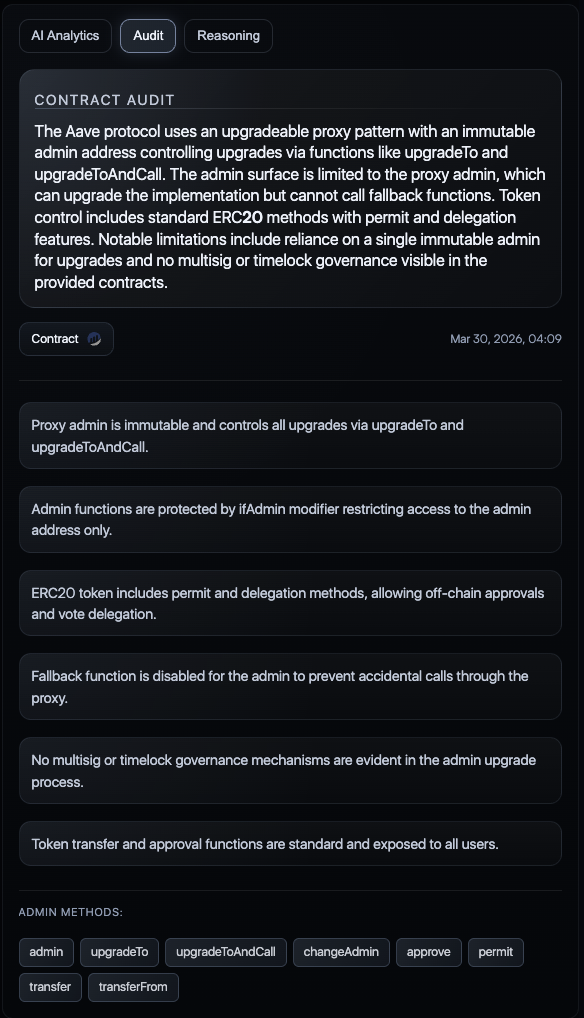
The Audit tab exposes Quantir's automated smart-contract intelligence layer. It is designed to summarize contract-level risk context in a way that is directly useful for monitoring, not just for static review.
What The Module Does
- analyzes the smart contract surface with a neural audit workflow
- identifies important or potentially risky methods
- highlights privileged, administrative, or upgrade-related controls
- summarizes notable contract properties in plain language
- links contract-aware findings back into the broader risk-analysis workflow
Why It Matters
This module is important because contract intelligence is not treated as a passive note. The platform also watches how sensitive methods are used at runtime and uses that information as part of broader protocol interpretation and risk contribution logic.
That means the audit output is useful in two ways:
- it helps the user understand the protocol's control surface
- it helps the system interpret live behavior when tracked methods begin to fire
6. Reasoning Tab
Purpose
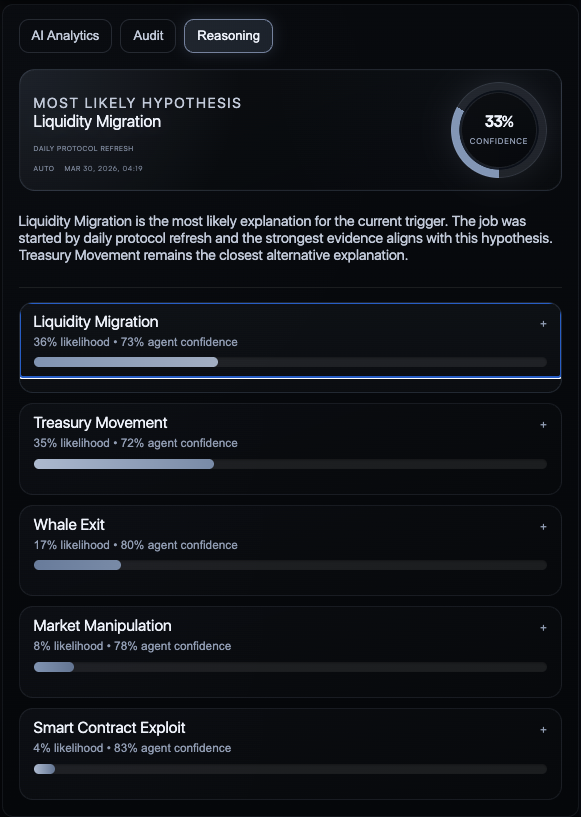
The Reasoning tab shows the discussion layer built on top of the risk core. This tab should be understood as interpretation, not as the source of the mathematical protocol risk score.
Current Model Of Reasoning
The current implementation uses several LLM-backed provider assessments in parallel against the same normalized context and the same active hypothesis set. In practical product terms, this appears to the user as several parallel agent perspectives followed by a fused result.
At the UI level, this means the tab exposes:
- ranked hypotheses
- likelihood and confidence signals
- per-hypothesis reasoning excerpts
- agent-specific views on why a hypothesis is or is not supported
Why It Matters
This gives the user more than a flat alert. It shows how the interpretation was formed and what competing explanations were considered before the final reasoning surface was produced.
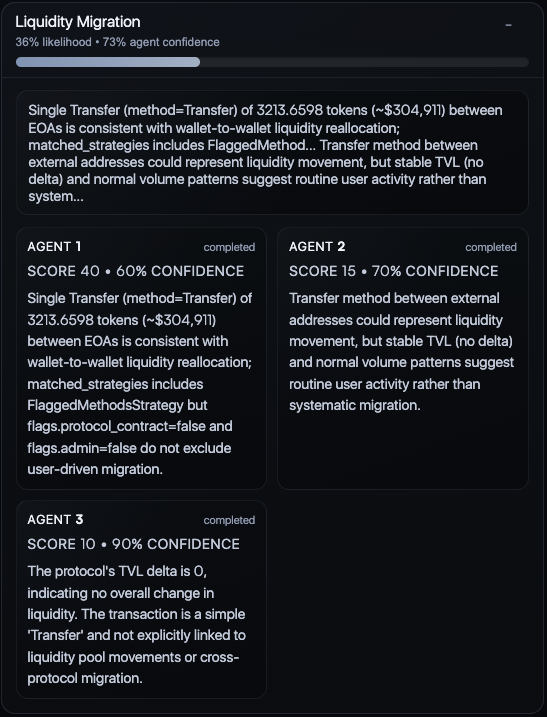
7. Hypothesis Detail View
Purpose
When a user expands a specific hypothesis, the interface moves from ranked summary to detailed argument inspection. This view is where the user can examine how different agent assessments contributed to one hypothesis in particular.
What The User Can Inspect
- hypothesis likelihood
- aggregate confidence
- summarized reasoning
- agent-by-agent scores
- agent-by-agent confidence
- short per-agent argument text
Why It Matters
This view makes the explanation layer feel inspectable rather than opaque. A user can see not only which hypothesis is stronger, but also where agreement, disagreement, or uncertainty exists across the participating model outputs.
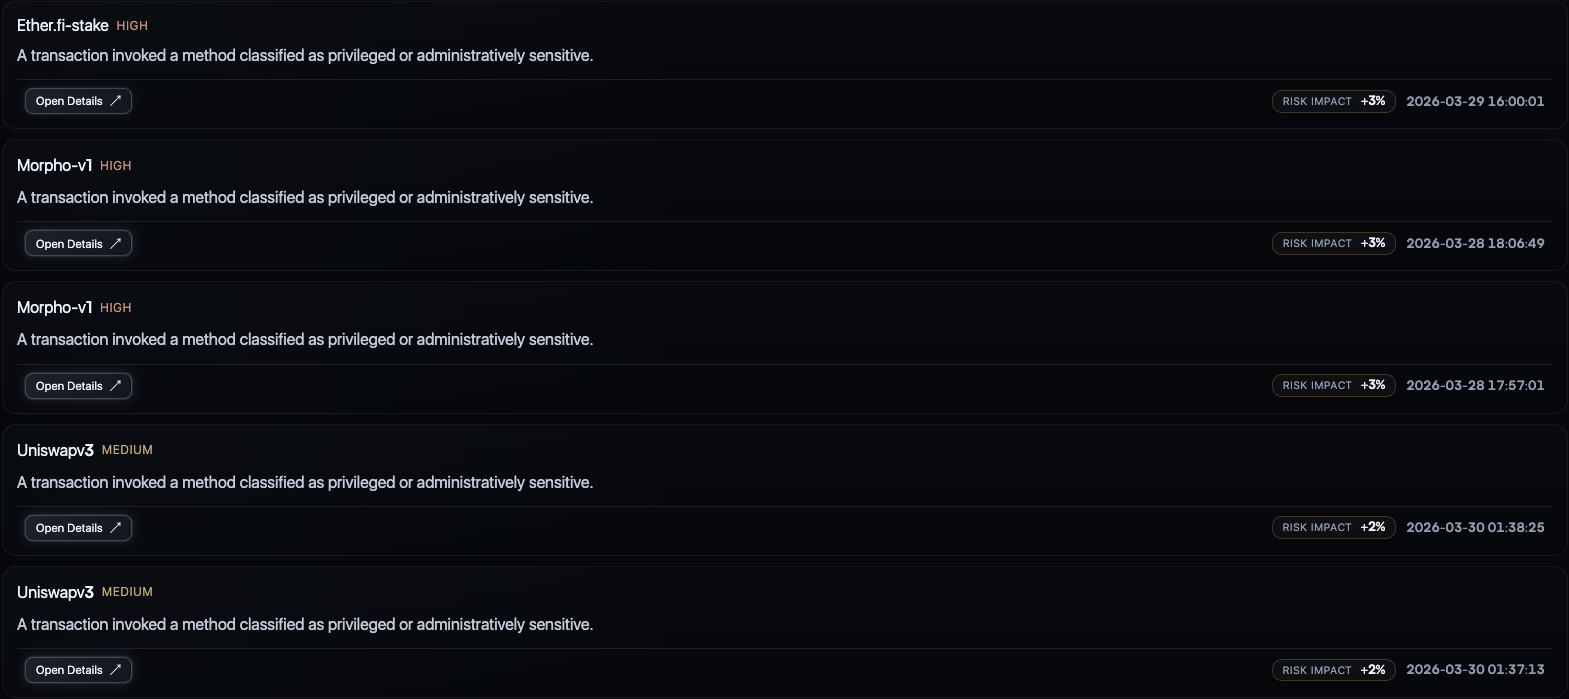
8. Suspicious Transactions Feed
Purpose
The suspicious transactions feed is the bridge between protocol-level scoring and concrete on-chain events. It translates abstract risk movement into exact transactions the user can inspect.
What The Feed Surfaces
- source and destination addresses
- transaction hash
- transferred value
- method name
- estimated impact on risk
- event timestamps
Why It Matters
This is one of the most operationally important modules in the product. It gives the user a concrete event trail and helps answer a critical question: what exactly happened on-chain that pushed the protocol into a different interpreted state?
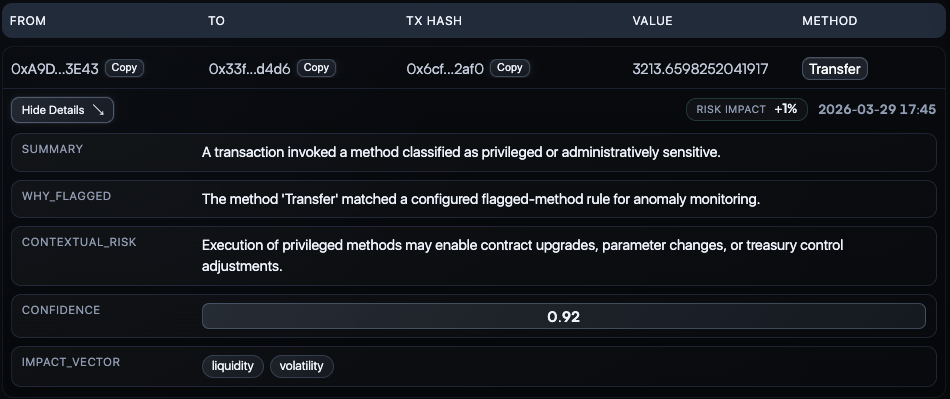
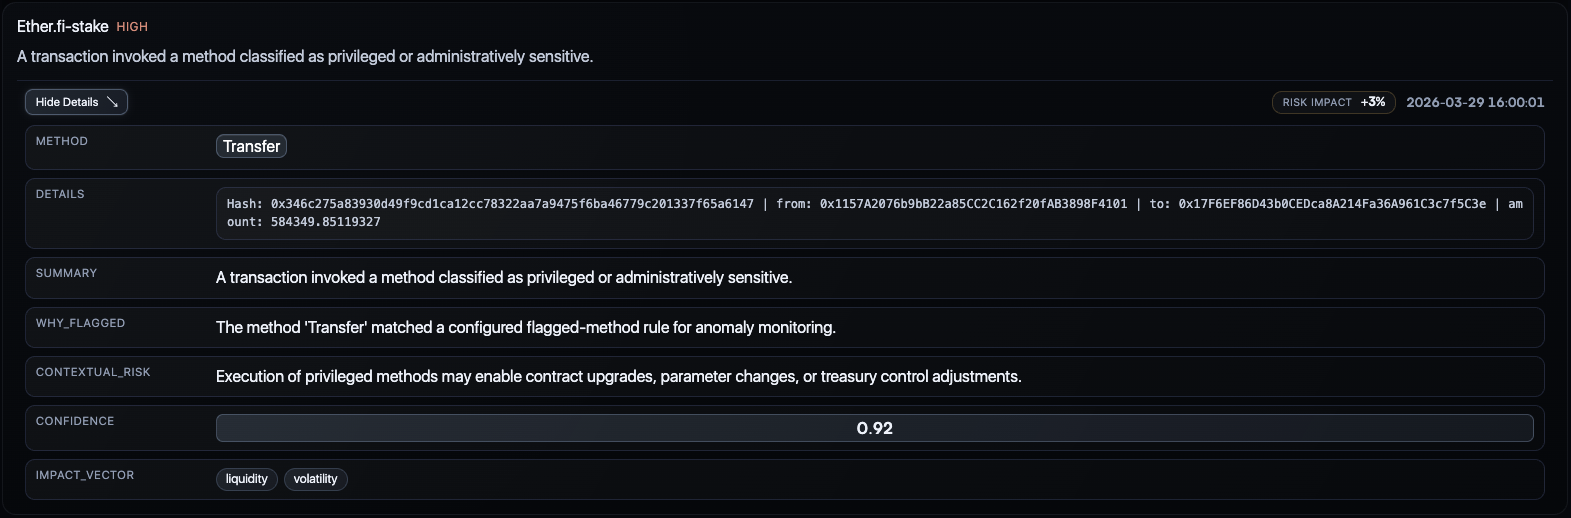
9. Transaction Detail Views
Purpose
The transaction detail views expand an individual flagged event into a structured explanation artifact. Instead of showing only a hash and a value, the system explains why the event was flagged and how it relates to current protocol concern.
What Appears Here
- the detected method
- transaction details and hash
- short event summary
- why the event was flagged
- contextual risk statement
- confidence value
- impact vector
Why It Matters
This is the level where the product becomes directly usable for auditability and operator review. The user can inspect a flagged event and understand not only that it was unusual, but why the system considered it relevant.
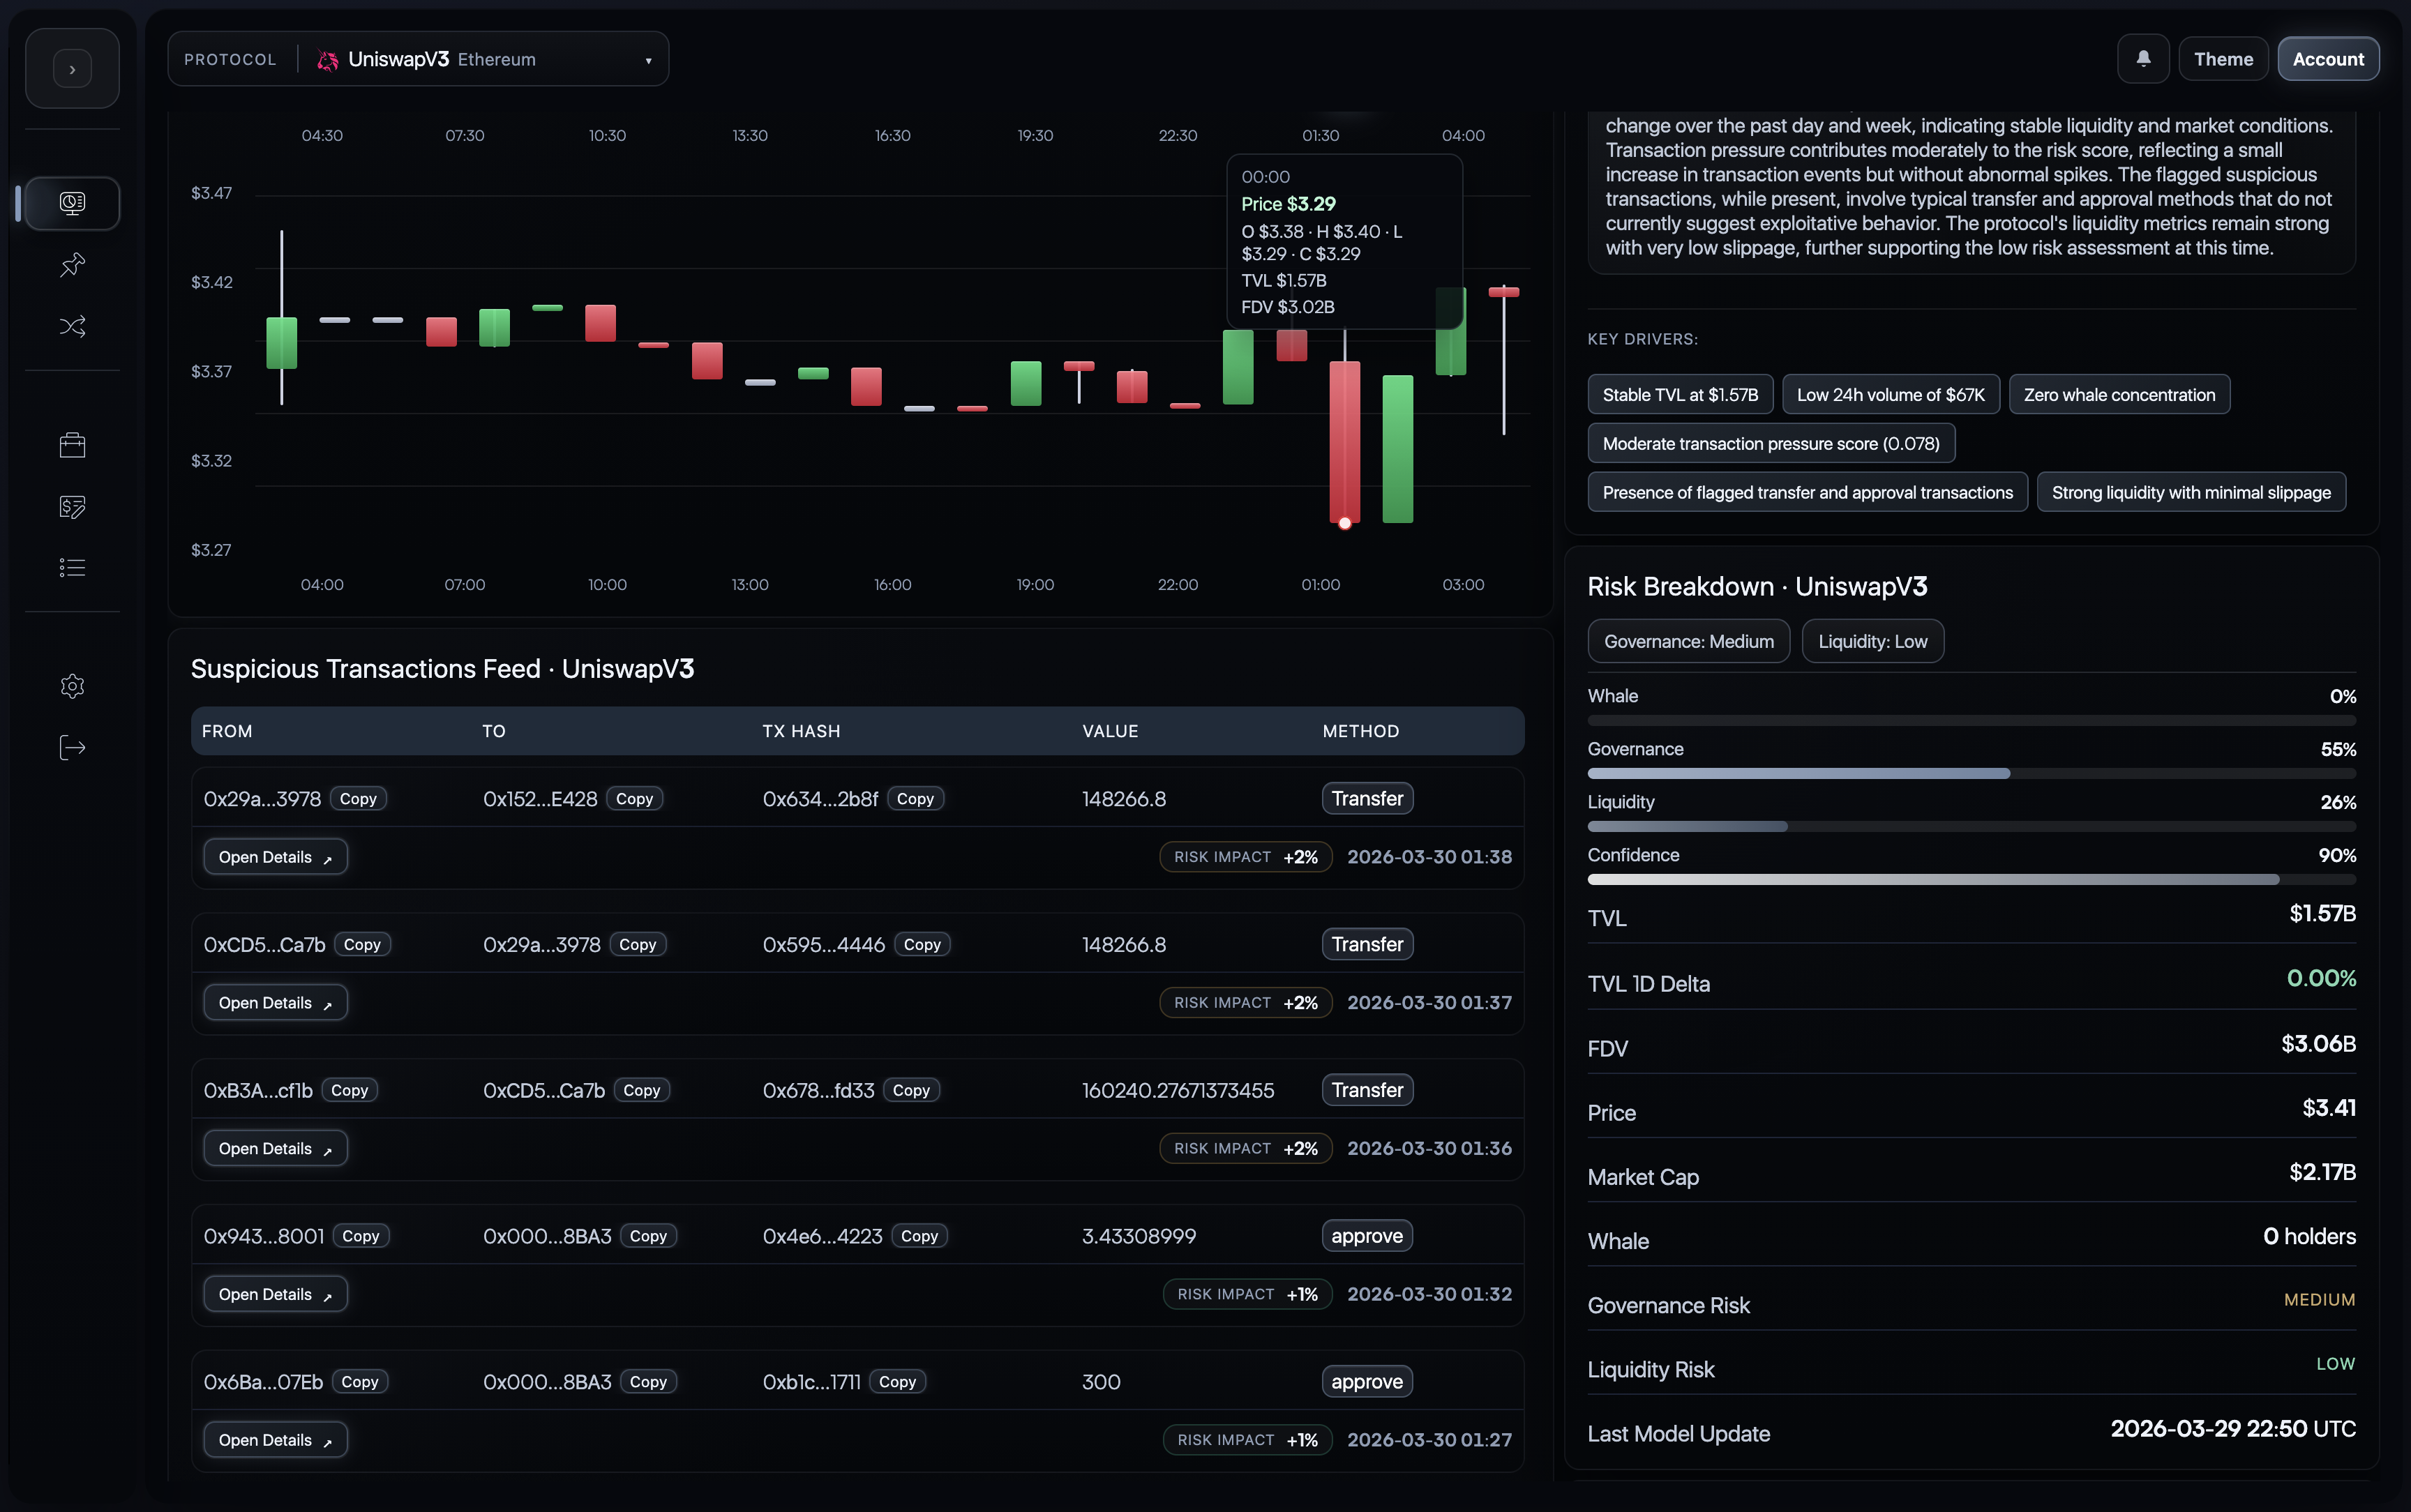
10. Integrated Evidence And Breakdown View
Purpose
Some dashboard compositions are best understood as integrated evidence surfaces rather than isolated widgets. In this layout, the user can read transaction evidence, summary logic, and colder protocol metrics together without leaving the current protocol workspace.
What This Combined View Shows
- suspicious transaction evidence
- summary interpretation
- key drivers
- risk breakdown metrics
- protocol-state figures such as TVL, FDV, price, and update timing
Why It Matters
This combined composition is important because it reflects how Quantir is meant to be used in practice: not as a single score, but as a score plus evidence plus context plus interpretation.
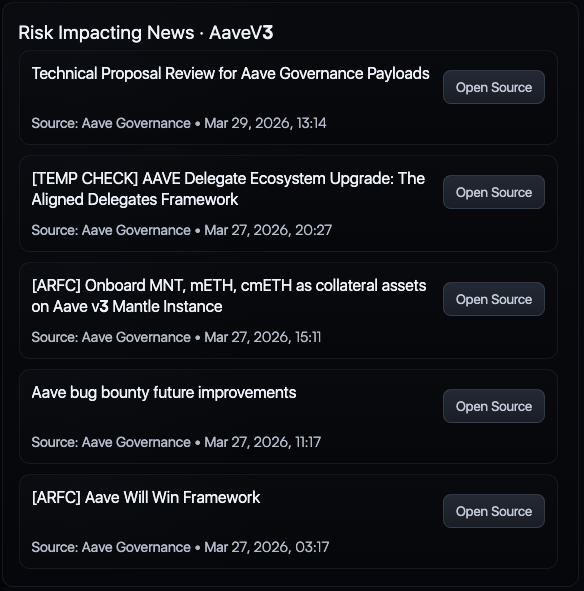
11. Risk-Impacting News
Purpose
The news panel extends protocol monitoring beyond pure on-chain state. It surfaces governance updates, public announcements, and other relevant external materials that can materially change the risk context around a protocol.
What The User Gets
- recent items tied to the monitored protocol
- source attribution
- timestamps
- direct source links for verification
Why It Matters
Protocol risk is often shaped by governance proposals, public operational updates, and ecosystem developments before the full impact becomes visible in on-chain numbers alone. This panel helps place external context next to internal protocol evidence.
12. How To Read The Product As A Whole
The Quantir UI is built around one operating idea: the user should be able to move from monitoring to investigation to explanation without changing tools.
In practical terms, the flow is:
- select and monitor protocols in the watchlist
- open the most relevant protocol dashboard
- inspect the near-horizon forecast through
Live | Prediction - inspect the current state through AI Analytics
- review contract-aware findings in Audit
- examine competing interpretations in Reasoning
- confirm or challenge the interpretation through transactions, metrics, and news
This is why the UI should be read as one connected workflow rather than as a collection of independent panels.