Use Cases
Whitepaper | Quantir UI Walkthrough | Use Cases | DeFi Risk Engine | Roadmap
Multi-Stage Risk Accumulation and Delayed Market Reaction
This case documents one of the core patterns Quantir is built to surface: protocol risk can accumulate through several distinct phases before the market visibly reprices the deterioration.
The main value of this case is not that price eventually falls. The important point is that the evidence stack shows structural stress building earlier, while the visible market state still appears relatively stable.
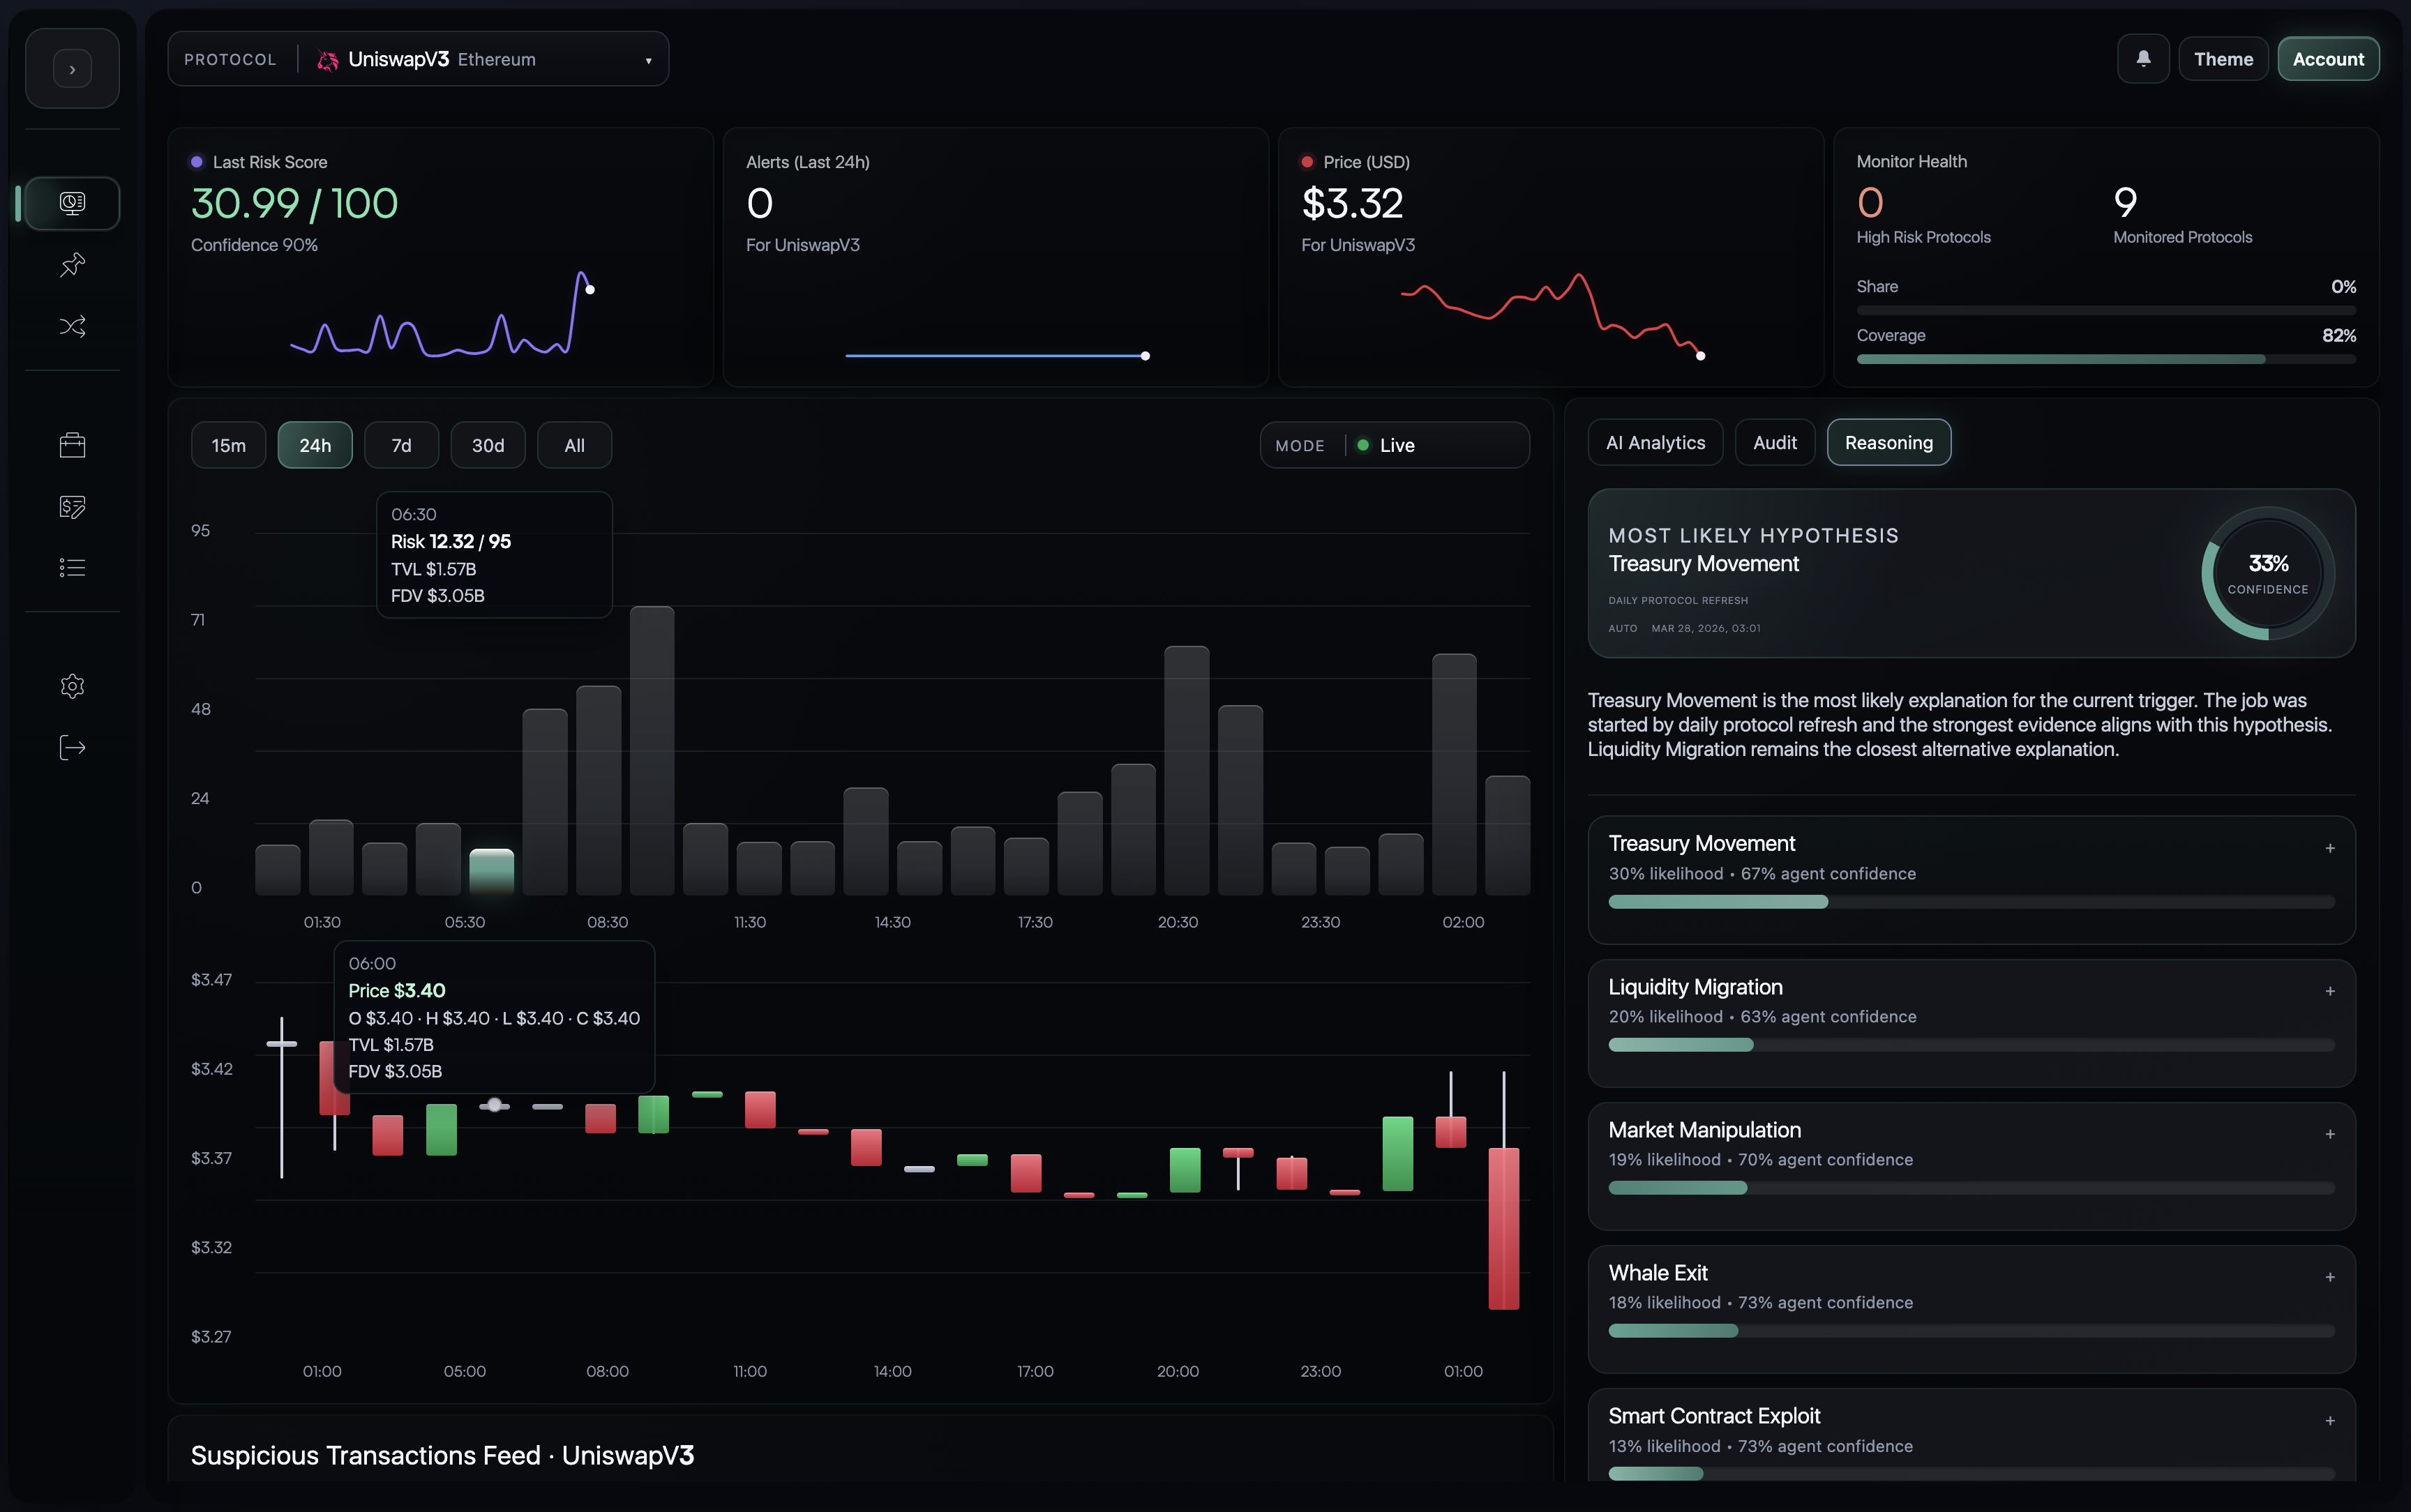
The system demonstrates the ability to detect multi-stage risk accumulation prior to visible market impact.
As illustrated in the figure:
- the risk score exhibits a clear upward trajectory, indicating continuous structural stress buildup within the protocol
- this growth is not linear but occurs in distinct impulsive phases, suggesting episodic abnormal activity rather than random noise
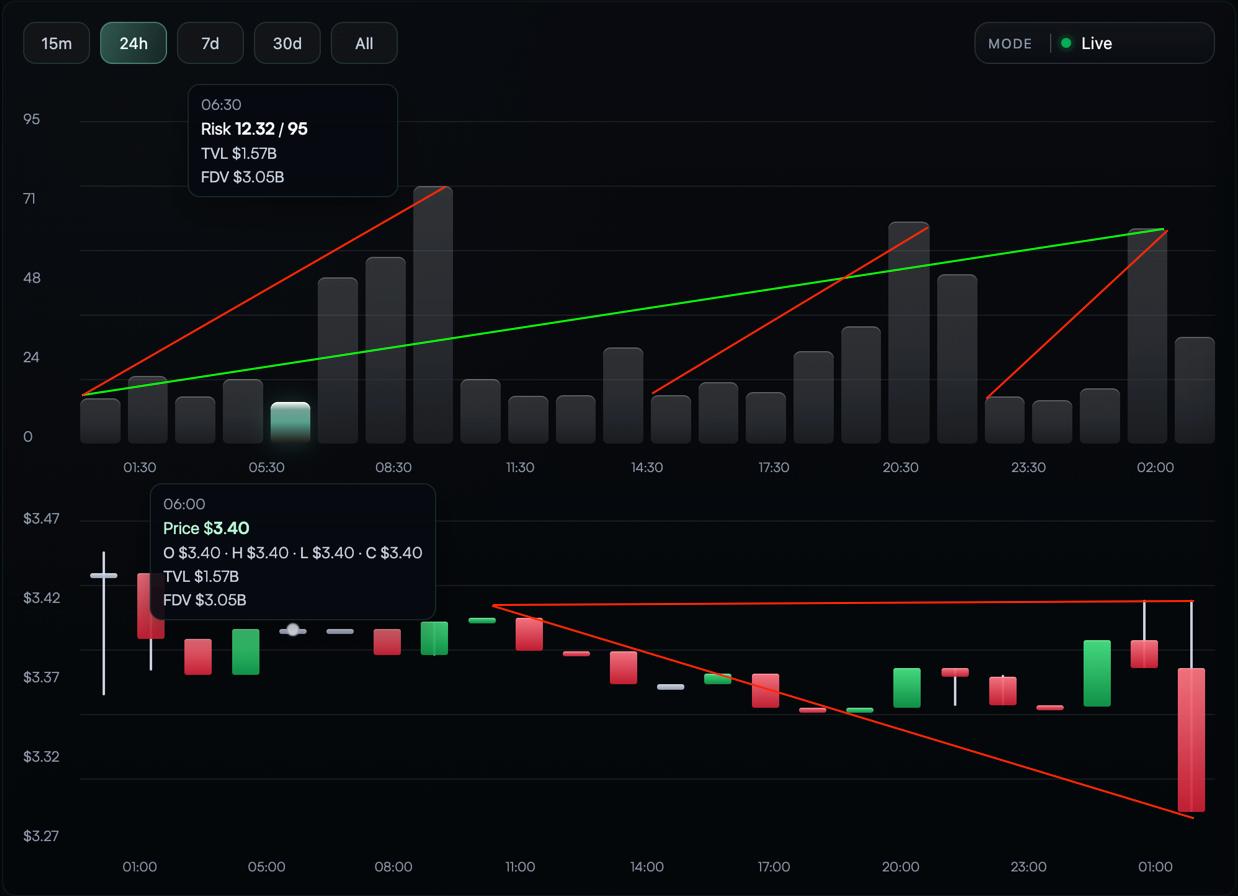
Despite these signals:
- price remains within a narrow range, forming a temporary equilibrium
- no immediate breakdown occurs, masking the underlying risk dynamics
This creates a critical divergence:
Rising modeled protocol risk versus externally stable market conditions.
Hidden Divergence and Structural Weakness
While price action still appears stable, the system identifies:
- repeated abnormal behavioral spikes
- increasing frequency of high-risk events
- accumulation of unresolved systemic pressure
This results in a latent instability phase, where:
- market participants are largely unaware
- traditional indicators remain quiet
- risk continues compounding beneath the visible surface
Event Realization
Following the accumulation phase, the system observes:
- a sharp downward price movement
- breakdown of the previously stable range
- rapid realization of previously accumulated risk
Importantly:
The price movement occurs after the majority of risk signals have already been detected.
Key Insight
This case demonstrates a fundamental property of the system:
The model operates as a leading indicator, not a reactive one.
Unlike traditional analytics:
- it does not rely on price confirmation
- it captures pre-market structural changes
- it identifies risk before it becomes obvious in standard market views
Interpretation of Pattern
The observed structure can be summarized as five phases:
- Initial equilibrium phase
- Incremental risk accumulation (hidden phase)
- Impulse-based anomaly spikes
- Divergence formation between risk and price
- Delayed market reaction and price breakdown
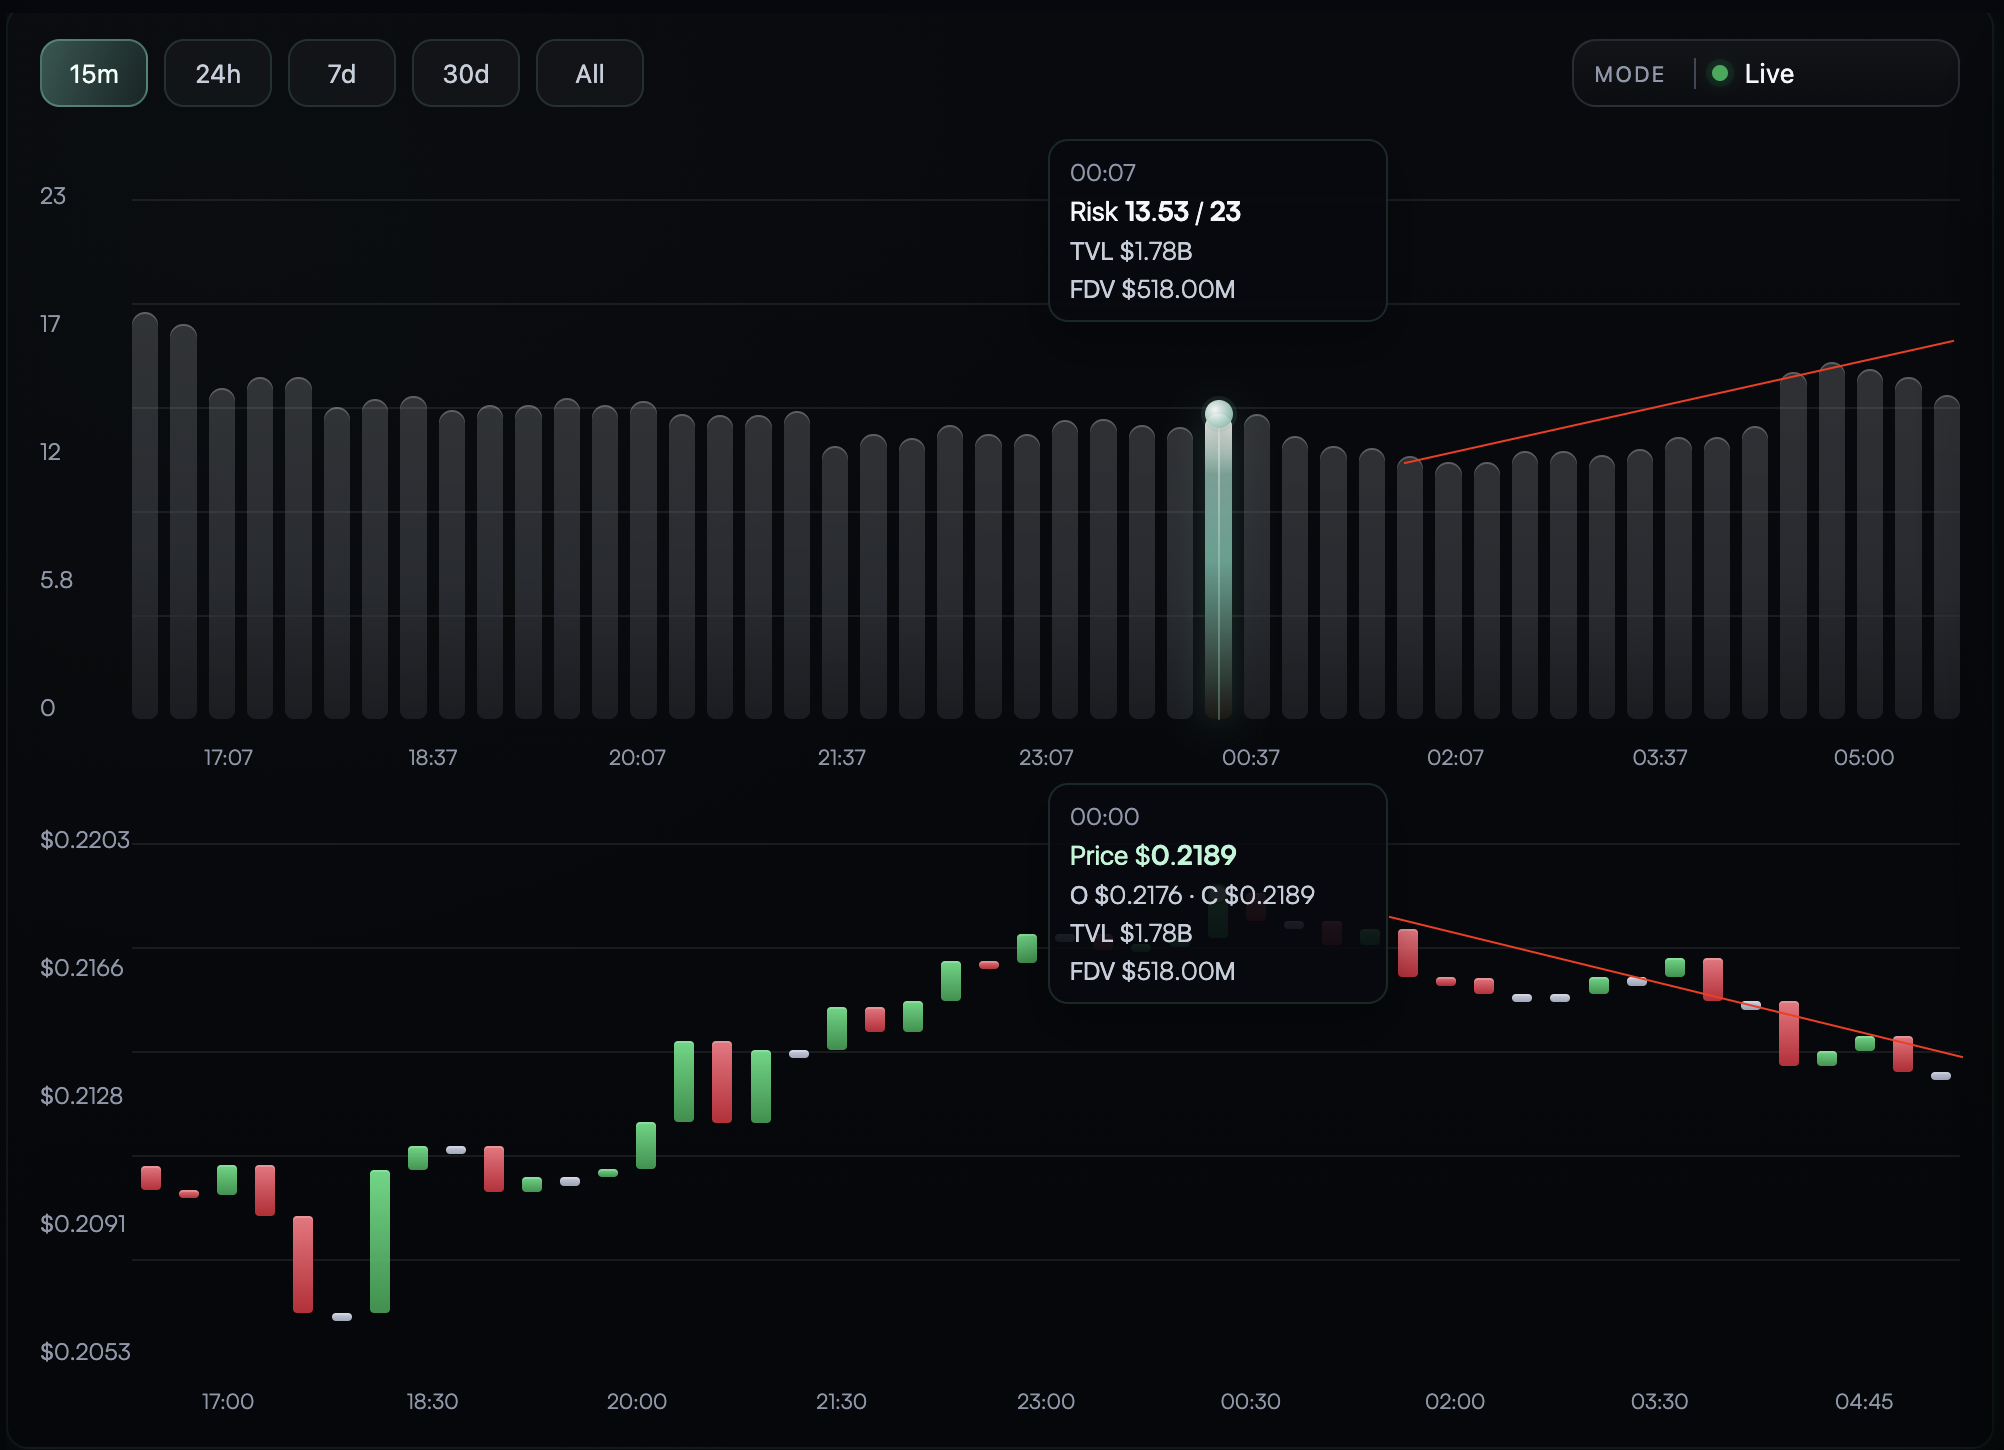
Decoupling of Risk Signal from Traditional Metrics
A key property of the system is its ability to detect risk escalation independent of traditional market indicators.
In the observed interval:
- risk score increased from 9.04 to 13.82 or roughly +52%
- TVL remained effectively unchanged at approximately $23.78B to $23.80B
- FDV showed no meaningful variation at approximately $1.57B to $1.58B
This demonstrates a clear decoupling between modeled risk signals and external liquidity metrics.
While conventional monitoring systems often rely heavily on:
- liquidity changes such as TVL
- valuation shifts such as FDV
this system captures:
- behavioral anomalies
- structural interaction changes
- early-stage instability signals
that are not reflected in aggregated metrics.
Significant risk can accumulate even when major observable indicators appear stable.
This allows the system to:
- detect early-stage risk formation
- identify hidden stress conditions
- provide signals before any visible degradation in protocol metrics
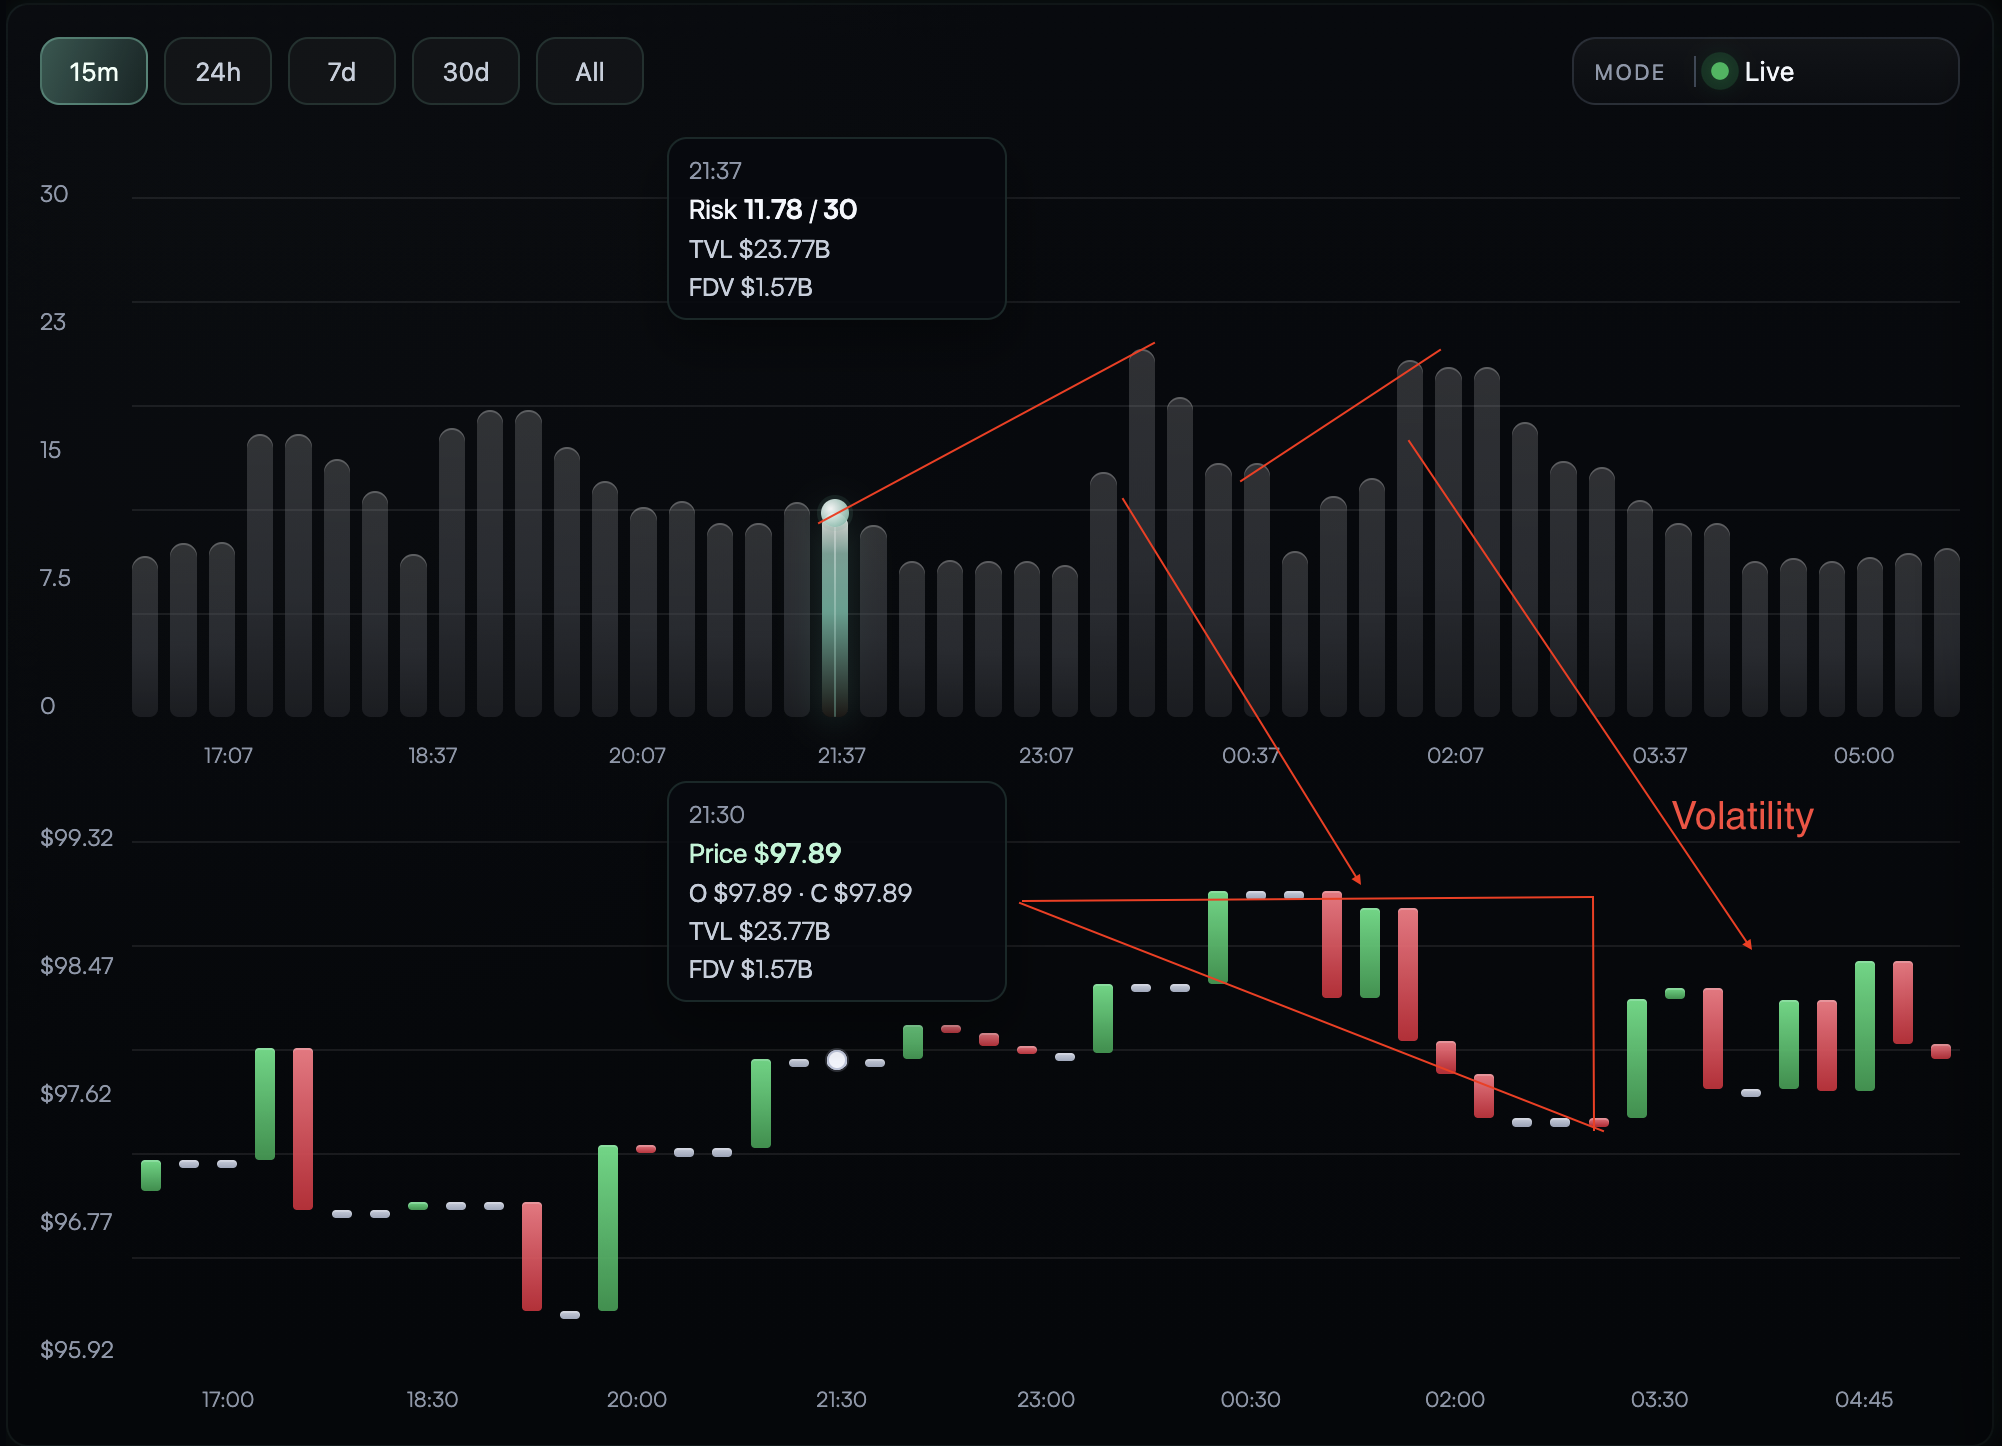
On-Chain Activity Driven Risk Escalation
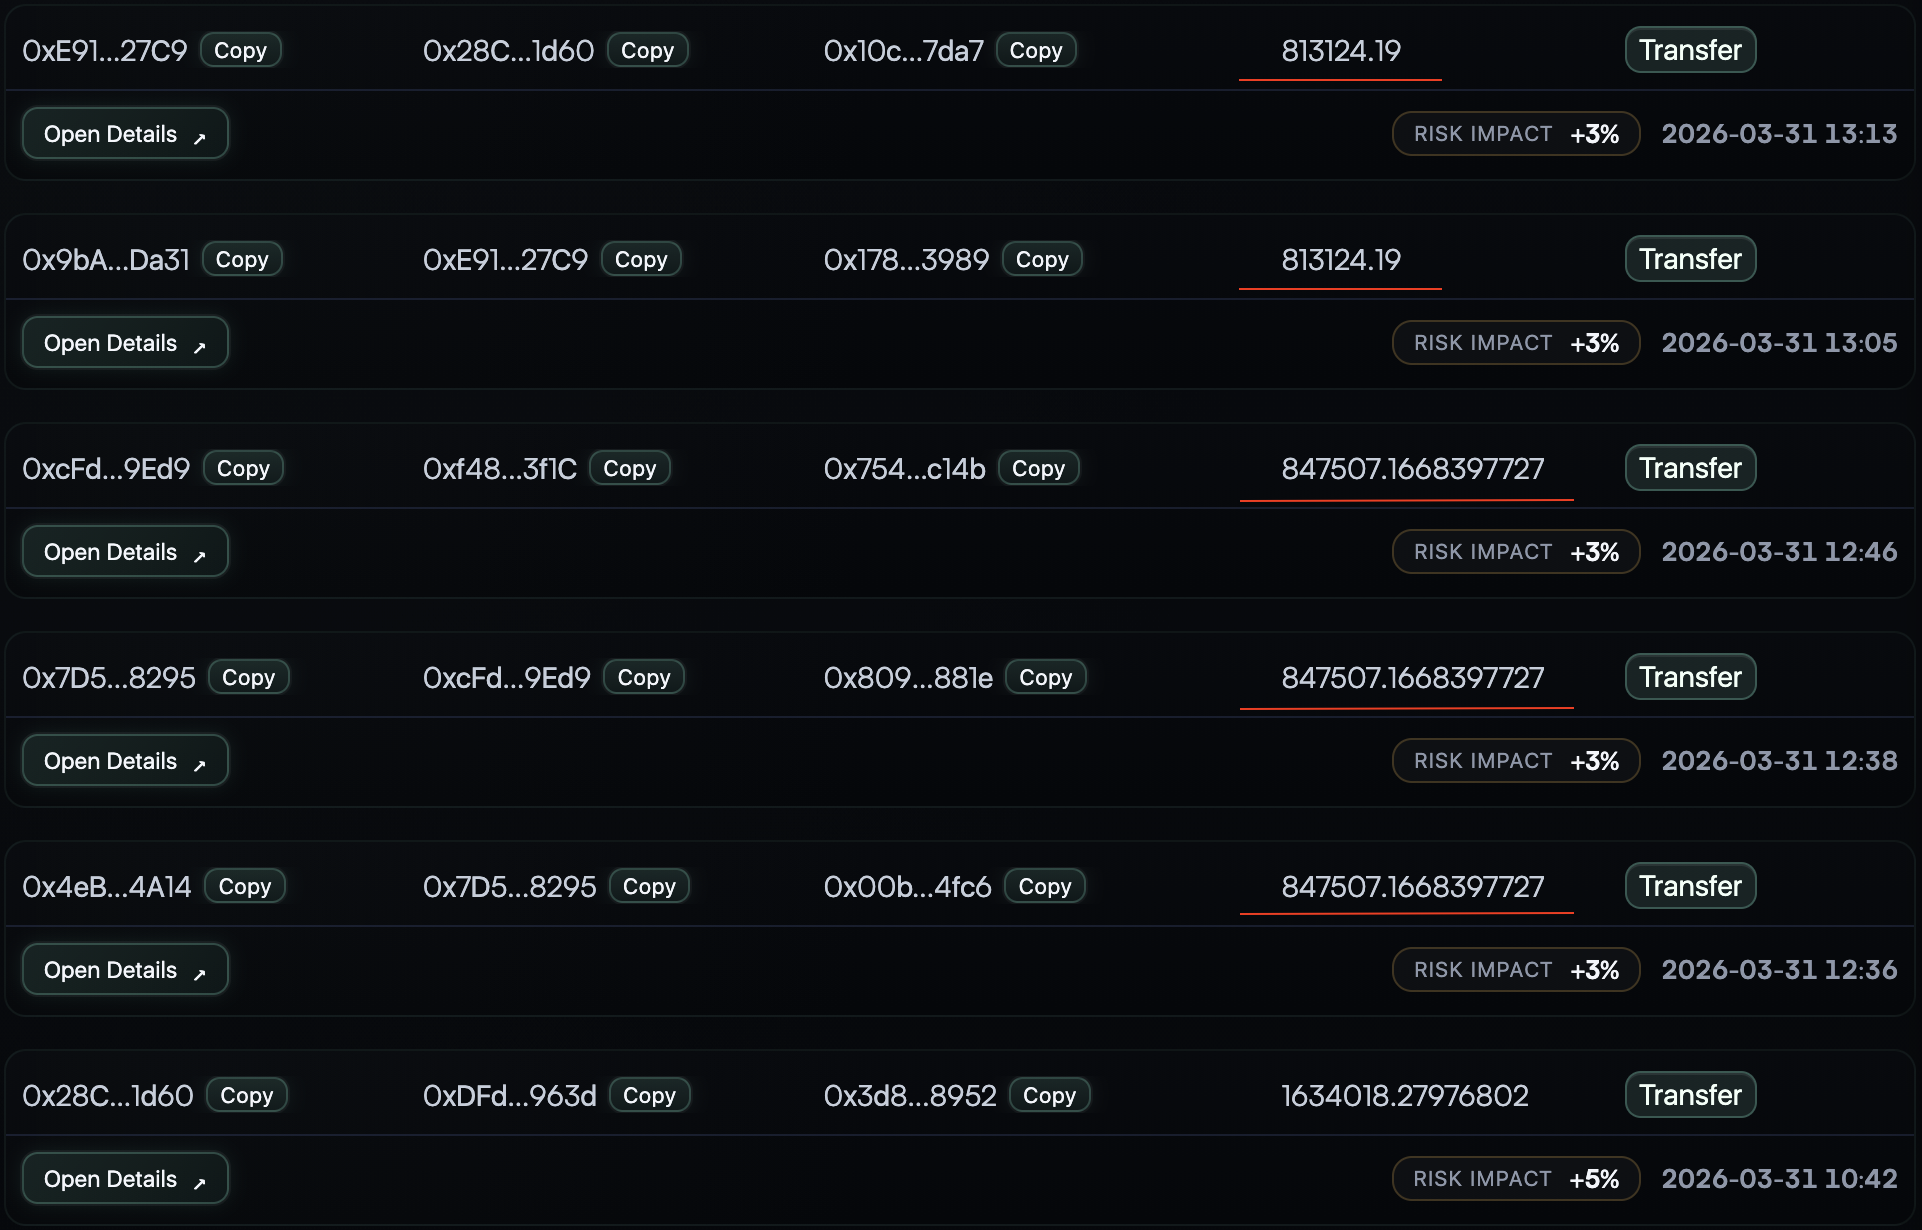
This case also demonstrates the system's ability to directly link on-chain activity to risk formation and later market behavior.
During the observed interval:
- a series of large transactions greater than $800k were executed
- repeated transfer patterns between addresses were detected
- additional contract interactions such as approvals were observed
- individual events contributed approximately +3% to +5% each to the total risk score
As these events accumulated:
- the risk score showed a steady upward trend
- no significant changes in TVL or FDV were observed
- price initially remained stable
This indicates that:
the system captures behavior-driven risk, rather than relying only on aggregated metrics
Following the accumulation of these on-chain signals:
- price momentum weakened
- trend reversal appeared
- a downward move developed
Importantly:
the price reaction followed the sequence of risk-triggering events, not the other way around
This highlights another core capability:
The system provides causal interpretability, linking risk signals to specific blockchain actions.
Unlike traditional dashboards:
- it does not only detect anomalies
- it also explains why the risk is increasing
Why This Use Case Matters
This case supports several product-level claims already made in the whitepaper:
- Quantir should be understood as a leading-indicator system rather than a price-only alert surface
- lead-time has direct economic value when reaction cost is measurable
- protocol deterioration does not need to be fully visible in price, TVL, or FDV to become operationally important
- transaction evidence and structural interpretation are more useful together than in isolation
- explanation matters because users need to understand not only that risk is increasing, but also what is driving it
Operational Reading
For reaction-sensitive users, the practical lesson is straightforward. A system becomes valuable when it surfaces deterioration while the user can still act under materially better conditions than a post-facto price alert would allow. In this case, the evidence stack matures before the market breakdown, which is exactly the window in which exposure can be reduced, liquidity can be rotated, or hedges can be adjusted with less slippage and less forced urgency.